10-yr Treasury yield, plus March jobs report, bank lending, and S&P 500's tepid recovery
The Sandbox Daily (4.10.2023)
Welcome, Sandbox friends.
Today’s Daily discusses:
yields retest prior-cycle peak
March jobs report
Fed’s bank lending report shows slump in lending activity
S&P 500’s tepid recovery
Later this week, the government will release its latest reports on inflation with the Consumer Price Index (CPI – Wednesday) and Producer Price Index (PPI – Thursday) as investors look for further evidence of progress among the disinflation theme. The week ends on the Retail Sales report that will provide further insight into consumer spending patterns.
Some of the world's biggest banks will kick off earnings season with their latest financial results on Friday; these reports will be heavily scrutinized in the wake of the collapse Silvergate Bank, Silicon Valley Bank, and New York Signature Bank.
And last, but definitely not least, happy 72nd birthday mom!
Let’s dig in.
Markets in review
EQUITIES: Russell 2000 +1.02% | Dow +0.30% | S&P 500 +0.10% | Nasdaq 100 -0.09%
FIXED INCOME: Barclays Agg Bond -0.69% | High Yield -0.09% | 2yr UST 4.014% | 10yr UST 3.419%
COMMODITIES: Brent Crude -1.01% to $84.27/barrel. Gold -0.96% to $2,006.9/oz.
BITCOIN: +3.51% to $29,136
US DOLLAR INDEX: +0.45% to 102.550
CBOE EQUITY PUT/CALL RATIO: 0.69
VIX: +3.10% to 18.97
Quote of the day
“Games are won by players who focus on the playing field – not by those whose eyes are glued to the scoreboard.”
-Warren Buffett
Yields retest prior-cycle peak
The 10-year Treasury yield posted fresh six-month lows late last week, now sitting just above a key polarity level – former resistance turning into support levels as a confluence of buyers and sellers and long-term price memory all converge.
Like many risk assets over the past year, it’s retesting its former 2018 highs near 3.25%, which mark the peak of the previous cycle.
This would be a logical level for the decline in yields to pause, with perhaps today being an example of just that. Treasuries have rallied sharply from the early March highs – defying last year’s trend of positive correlation with Equities – and yield curves have steepened dramatically.
On the other hand, a print below 3.25% could signal a bearish trend reversal. If and when that happens, long-duration assets such as longer-maturity bonds, growth stocks, and precious metals could stand to benefit.
Source: All Star Charts
BLS March labor report
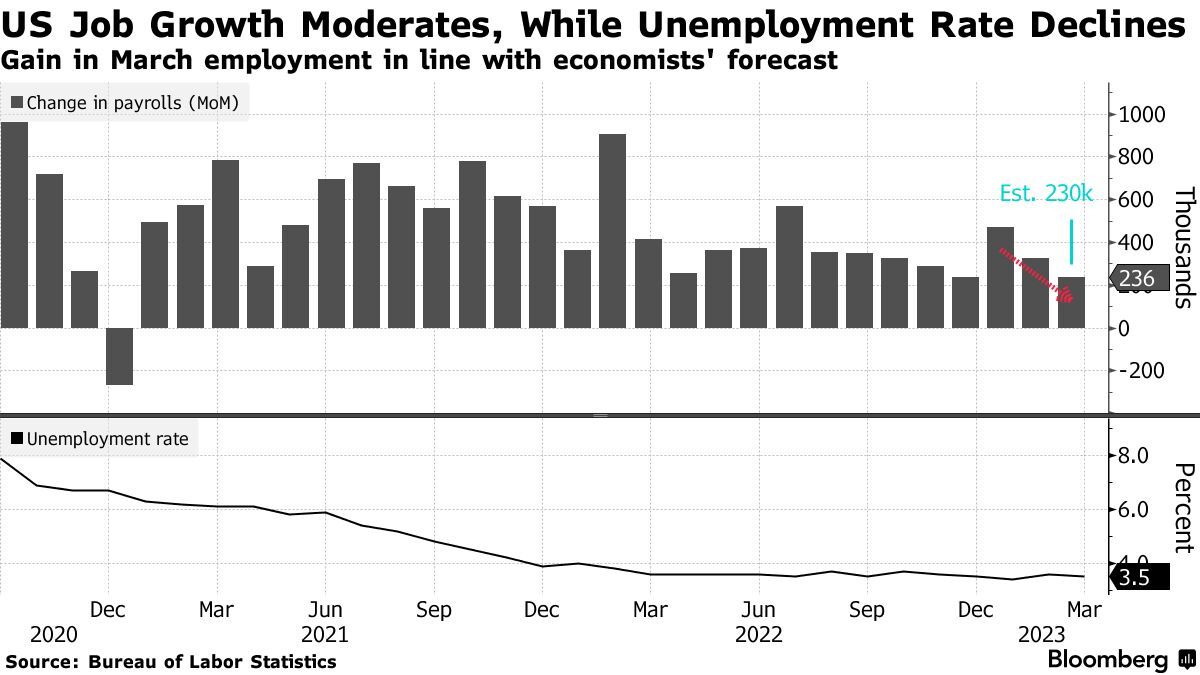
On Friday last week – a rare occurrence where a major economic report was released while the market was closed – the government's March jobs report showed non-farm payrolls grew by 236,000 for the month, slightly below estimates.
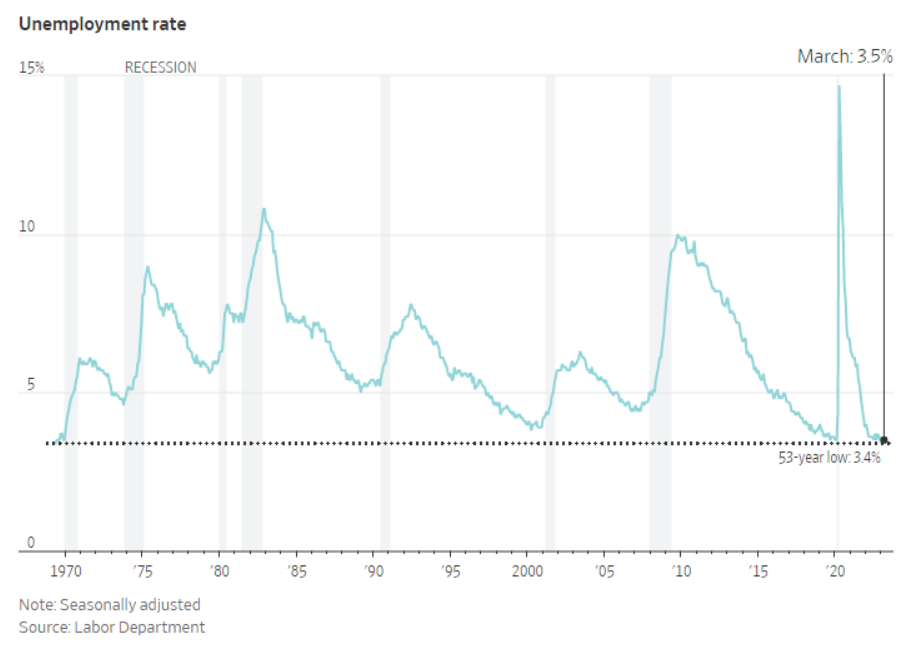
The unemployment rate fell from 3.6% to 3.5% after setting the record low of 3.4% in January. The labor force participation rate was 62.6% in March, up from 62.5% in February and 62.4% in January – a great sign for the Fed and now just 0.7% below its pre-pandemic peak.
Elsewhere, average hourly earnings rose +0.3% MoM and +4.2% YoY, still way above the 2% target rate of inflation the Fed mandates.
On one side, more Americans jumping into the labor market will help continue taking pressure off further wage increases, while on the other side, strong monthly jobs gains and a 53-year low unemployment rate likely keep the Fed on track for another 0.25% interest rate hike at its May FOMC meeting.
Source: Ned Davis Research, Wall Street Journal, Bloomberg
Fed’s bank lending report shows slump in lending activity
The Federal Reserve reported that bank lending slumped by the most on record in the final two weeks of March, indicating credit is tightening in a significant way.
According to the Fed’s latest H.8 report, commercial bank lending dropped nearly $105 billion in the last two weeks of March, the most since the Federal Reserve began tracking the data in 1973. The drop was primarily due to a drop in loans by small banks. The drop in lending included fewer real estate loans as well as commercial and industrial loans (C&I).
The Fed’s report showed that by bank size, lending decreased $23.5 billion at the 25 largest banks and plunged $73.6 billion at smaller banks.
The report also indicated commercial bank deposits dropped $64.7 billion in the latest week, marking the 10th straight decrease that reflected a decline at large firms.
However, when you chart all commercial bank’s credit just over the last 5 years, the latest slowdown barely even registers.
Economists are closely monitoring the Fed’s weekly H.8 report, which provides an estimated weekly aggregate balance sheet for all commercial banks in the United States, to gauge credit conditions.
Source: Federal Reserve Assets and Liabilities of Commercial Banks in the United States, Bloomberg, Investor’s Business Daily
Tepid recovery for the S&P 500
It has been 122 days and counting for the S&P 500 that the popular U.S. stock market index has not recovered at least 20% from the market bottom.
If October was THE low for this cycle, the S&P 500 is already on track for the 2nd slowest 20% gain from a bear market low on record.
As Beat the Bench notes: “While nothing in markets has to happen, historically we see strong gains off the initial low, and that makes it at least more likely that a retest or new low could occur this cycle.”
Source: Beat the Bench
That’s all for today.
Blake
Welcome to The Sandbox Daily, a daily curation of relevant research at the intersection of markets, economics, and lifestyle. We are committed to delivering high-quality and timely content to help investors make sense of capital markets.
Blake Millard is the Director of Investments at Sandbox Financial Partners, a Registered Investment Advisor. All opinions expressed here are solely his opinion and do not express or reflect the opinion of Sandbox Financial Partners. This Substack channel is for informational purposes only and should not be construed as investment advice. Clients of Sandbox Financial Partners may maintain positions in the markets, indexes, corporations, and/or securities discussed within The Sandbox Daily.


