

3 signals that have my bullish spidey senses tingling
The Sandbox Daily (4.24.2025)

Welcome, Sandbox friends.
After a week off vacationing with my wife and kids in Anna Maria Island, FL, I’m excited to dive back into markets. Time outside away from the screens and creating memories with your family is food for the soul.
Today’s Daily discusses:
three signals that tilt bullish for patient investors
Let’s dig in.
Blake
Markets in review
EQUITIES: Nasdaq 100 +2.79% | S&P 500 +2.03% | Russell 2000 +2.00% | Dow +1.23%
FIXED INCOME: Barclays Agg Bond +0.55% | High Yield +0.90% | 2yr UST 3.803% | 10yr UST 4.317%
COMMODITIES: Brent Crude +0.57% to $66.50/barrel. Gold +1.97% to $3,358.9/oz.
BITCOIN: -0.17% to $93,579
US DOLLAR INDEX: -0.57% to 99.277
CBOE TOTAL PUT/CALL RATIO: 0.90
VIX: -6.96% to 26.47
Quote of the day
“If you get tired, learn to rest. Not to quit.”
- Banksy
Three signals that tilt bullish for patient investors
CFAs and CMTs – while rooted in different disciplines (fundamental versus technical analysis) – have a deep appreciation for each other’s work and can complement one other by offering a more holistic view of markets.
By combining macro and valuation insights with price trend and momentum analysis, investors improve their probabilities of success with respect to asset allocation, risk management, conviction, and timing. Embracing both perspectives enhances their decision-making process.
During highly volatile markets, leaning into technicals can offer more timely insights than fundamentals, as it captures rapid shifts in sentiment, liquidity, positioning, and risk appetite even when valuations remain largely unchanged.
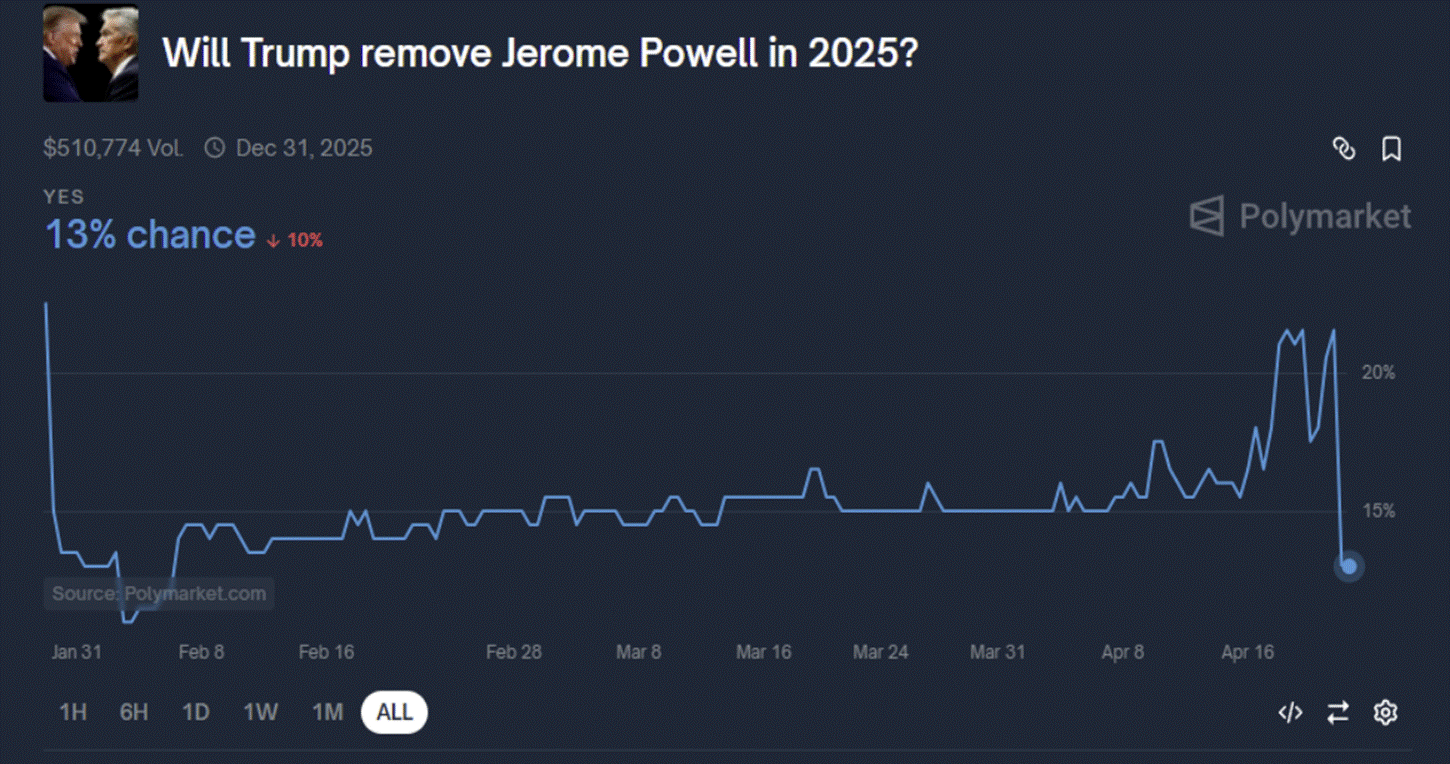
As of mid-day Monday, the headlines were grim. Little progress had been made in the dozens of bilateral trade deals the administration was seeking. President Trump said that Powell’s termination “can’t come fast enough.” The global trade war uncertainty remained a dark cloud looming over Q1 earnings season.
Fast forward to Thursday and whipsaw headline season painted a markedly different picture. Both President Trump and Treasury Secretary Bessent cooled the rhetoric on China, while Trump said he had “no intention of firing” Powell. Elong Musk said he will be transitioning from DOGE back to Tesla in May, while different companies offer a tariff sensitivity range to its 2025 earnings estimates.
In response, markets have responded favorably. In fact, the S&P 500 and the Nasdaq 100 have largely recovered their post-Liberation Day losses and sit just underneath key overhead levels.
Amidst the sea of negativity, here are three important developments that firmly have my attention. Call me bullish over intermediate- and longer-term time frames.
Zweig Breadth Thrust (ZBT)
A breadth thrust is a technical indicator that confirms a powerful shift in market momentum, often signaling the start of a potential new uptrend.
A specific and rare breadth signal – the Zweig Breadth Thrust (ZBT) – just triggered today.
A ZBT occurs when the 10-day exponential moving average of the NYSE percentage of up issues rises from below 40% (indicating an oversold market) to above 61.5% within 10 days. In plain English, the Advance-Decline numbers suddenly go from NOT good to REALLY good in a short amount of time.
ZBT’s don’t happen often and possess a sterling track record of coming within the vicinity of major lows – higher 6 months and 12 months later after all 16 signals since 1950.
And one thing we know from history is that breadth thrusts are NOT evidence of exhaustion.
In fact, it’s quite the opposite. We regularly see clusters of breadth thrusts near the beginning of new uptrends and/or early in bull markets – reflecting broad participation and strong buying pressure across a wide range of stocks.

Extreme Washout
For months, the trend has been lower. More recently, we’ve seen evidence of a total sellers’ frenzy.
The triangulation across high trading volumes, downside momentum, and historically poor sentiment are decent signs of excessive bearishness. Meaning, besides the marginal seller, who of size is left to really unload their book?
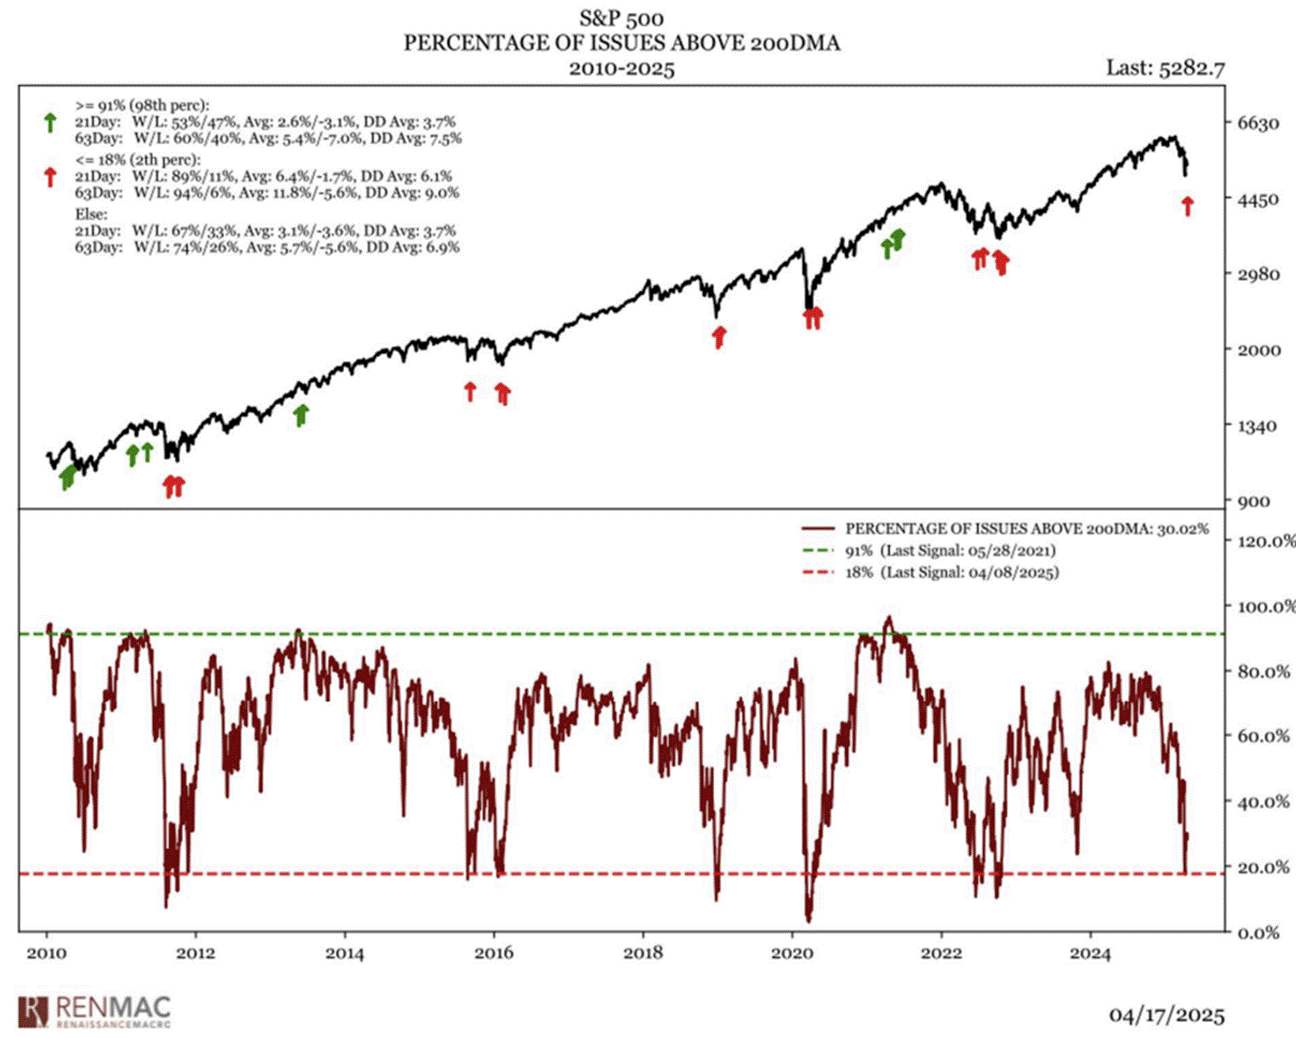
One simple way to measure oversold conditions is to look at the percentage of stocks above their 200-day moving average.
When the indicator drops below 15%, like it did at the bottom on April 7th, it usually means we’ve experienced a washout. This is in the bottom 2 percentile of all readings and it’s a time to start paying attention.
The signal to act comes when that percentage climbs back above 15%, or even better, 20-25%.
In recent days, this signal has also fired green and the setup across all time frames is quite bullish.
Credit Has Stabilized
With many different segments across equities looking to have completed massive tops, equity volatility confirmed the weakness – as evidenced by a VIX hitting the 50s and even 60 across multiple trading sessions.
But, the real signal comes from the bond market, which is far larger, of much greater importance, and the likely reason for President Trump’s policy pivot towards the 90-day reciprocal tariff freeze.
Here, it’s most helpful to look at spreads.
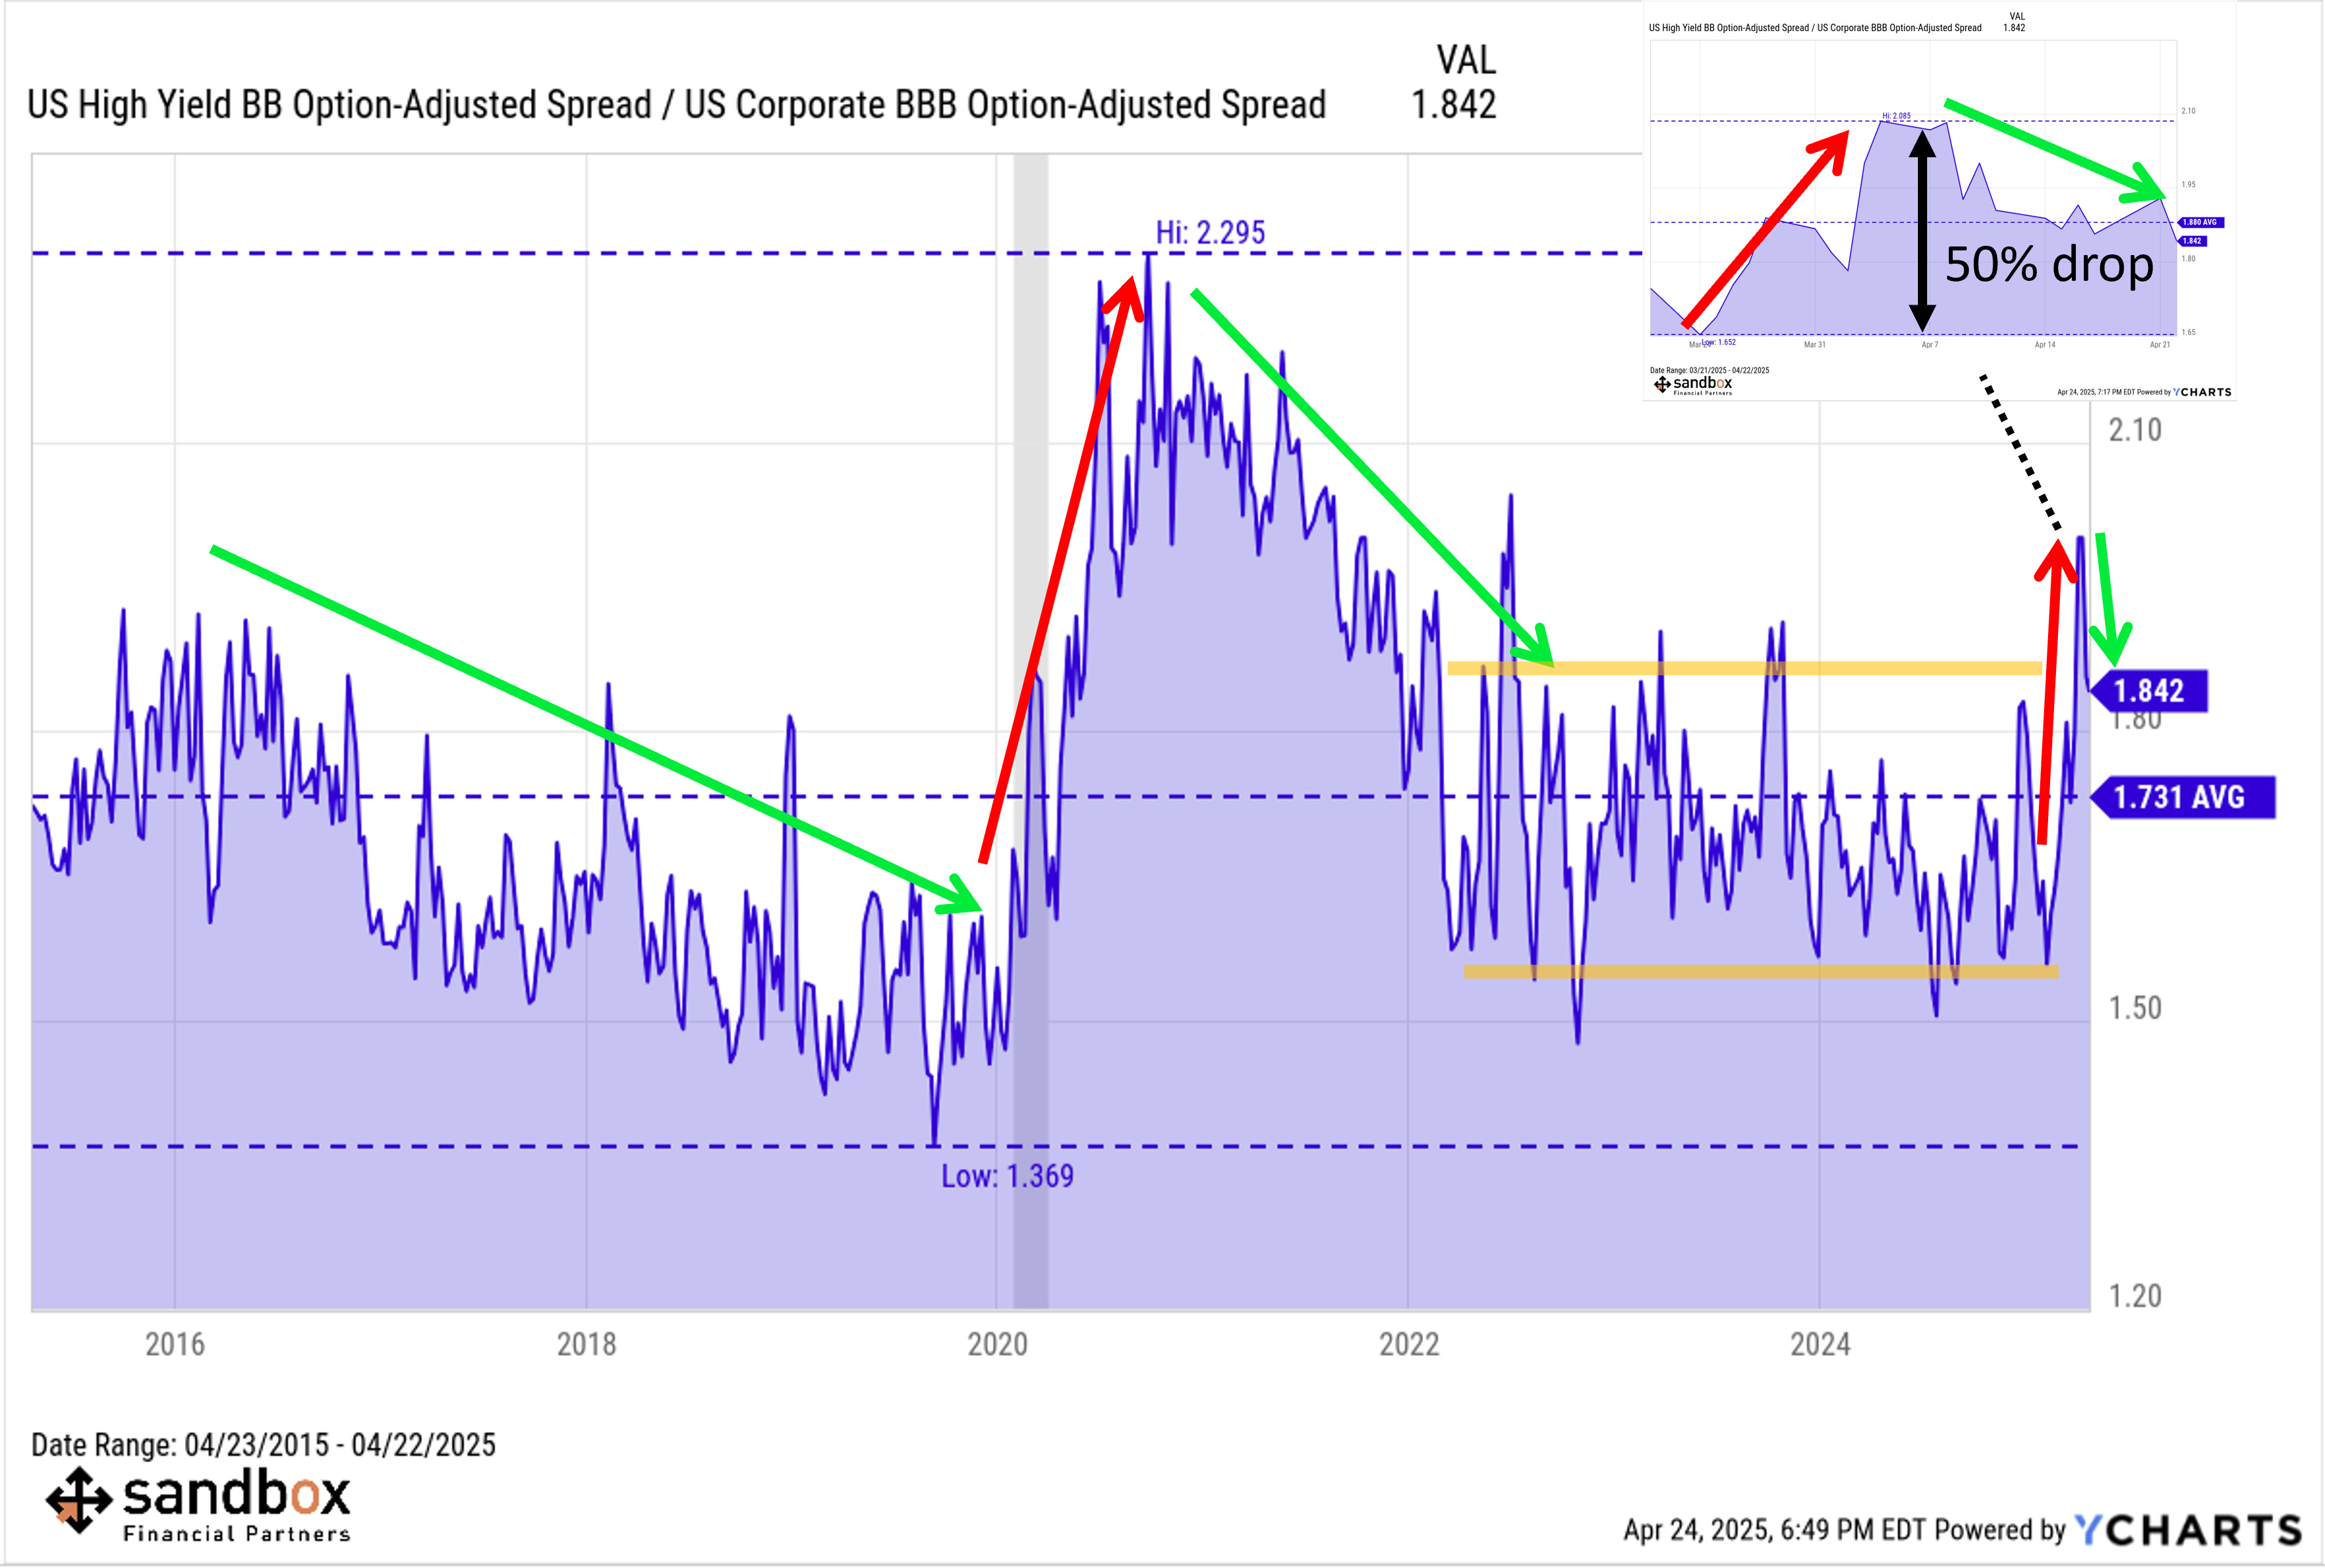
Below is the ratio of junk bonds (BB-rated bond issuers) to investment grade bonds (BBB-rated bond issuers). When the ratio is rising (falling), the perceived credit risk in the bond market is higher (lower).
While recent elevated yields had this ratio quickly probing new cycle highs since the end of the 2022 bear market, the tightening in spreads since the April 4th peak is quite encouraging. This ratio has reclaimed roughly half its rise from March to April, suggesting credit markets are calming down. Below, see the most-right green arrow pointing lower.
If there was serious systemic risk in the stock market, credit spreads would be confirm the move. Recently, spreads have been narrowing, not widening.
Equities benefit when credit spreads contract, and that’s exactly the environment we find ourselves in now.
Taken together, these important indicators look like a bear killer.
Make no mistake, the near-term picture remains hazardous. Earnings expectations are falling, while exactly zero trade deals have been negotiated since Liberation Day.
But, we must remember the market is a forward-looking discounting mechanism and certain technical signals are characterizing a more constructive outlook may be lurking around the corner.
Sources: SubuTrade, RenMac, YCharts
That’s all for today.
Blake
Questions about your financial goals or future?
Connect with a Sandbox financial advisor – our team is here to support you every step of the way!
Welcome to The Sandbox Daily, a daily curation of relevant research at the intersection of markets, economics, and lifestyle. We are committed to delivering high-quality and timely content to help investors make sense of capital markets.
Blake Millard is the Director of Investments at Sandbox Financial Partners, a Registered Investment Advisor. All opinions expressed here are solely his opinion and do not express or reflect the opinion of Sandbox Financial Partners. This Substack channel is for informational purposes only and should not be construed as investment advice. The information and opinions provided within should not be taken as specific advice on the merits of any investment decision by the reader. Investors should conduct their own due diligence regarding the prospects of any security discussed herein based on such investors’ own review of publicly available information. Clients of Sandbox Financial Partners may maintain positions in the markets, indexes, corporations, and/or securities discussed within The Sandbox Daily. Any projections, market outlooks, or estimates stated here are forward looking statements and are inherently unreliable; they are based upon certain assumptions and should not be construed to be indicative of the actual events that will occur.
Please see additional disclosures at the Sandbox Financial Partners website:
Blake, it just seems that we cannot place so much emphasis on technical analysis when the current market swings are based solely on the whims of one unstable person. We may be in the midst of a generational 'its different this time' as he moves the markets with a tweet