

60-40 portfolio, plus market sentiment, China's GDP growth, and a scary study from Credit Karma
The Sandbox Daily (4.18.2023)

Welcome, Sandbox friends.
Today’s Daily discusses:
BlackRock waves goodbye to 60-40 portfolio
market sentiment remains depressed
China’s economy gathers momentum
Credit Karma study rings the alarm bells
Let’s dig in.
Markets in review
EQUITIES: S&P 500 +0.09% | Nasdaq 100 +0.03% | Dow -0.03% | Russell 2000 -0.40%
FIXED INCOME: Barclays Agg Bond +0.14% | High Yield +0.07% | 2yr UST 4.203% | 10yr UST 3.574%
COMMODITIES: Brent Crude -0.04% to $84.73/barrel. Gold +0.52% to $2,017.4/oz.
BITCOIN: +2.59% to $30,256
US DOLLAR INDEX: -0.35% to 101.741
CBOE EQUITY PUT/CALL RATIO: 0.65
VIX: -0.71% to 16.83
Quote of the day
“We suffer more from imagination than reality.”
-Seneca, The Daily Stoic
Is this the top in 60-40 rhetoric?
BlackRock is waving goodbye to the traditional 60-40 portfolio.

Strategists from BlackRock Investment Institute stated the following adjustment:
Breaking up traditional asset allocation buckets, moving away from broad allocations to public equities and bonds. We think strategic views need to be more granular – across sectors and within private markets – to help build more resilient portfolios in the new regime. Strategic allocations of five years and beyond built on these old assumptions do not reflect the new regime we’re in – one where major central banks are hiking interest rates into recession to try to bring inflation down.
This is the wrong perspective and may mark the bottom in contrarian signals to buy the 60-40 portfolio on a go forward basis.
BlackRock’s take is two years too late, when both the stock and bond valuations were at their zenith. Now, both the stock and bubbles have burst, albeit rather painfully; in fact, 2022 was the worst year for the 60-40 portfolio since 2008 and the first calendar year since the inception of the bond index (1976) that both indexes were negative in the same year! 2022 was the exception, NOT the rule.

Of course, there will always be certain market regimes in which correlations between the two asset classes approach one, when both stocks and bonds drop simultaneously. So, investors will have to accept those years. Last year was that year (2022 is the orange dot below). Notice how few dots exist in the lower left quadrant of the NDR chart – when both stock and bond returns are concurrently negative.
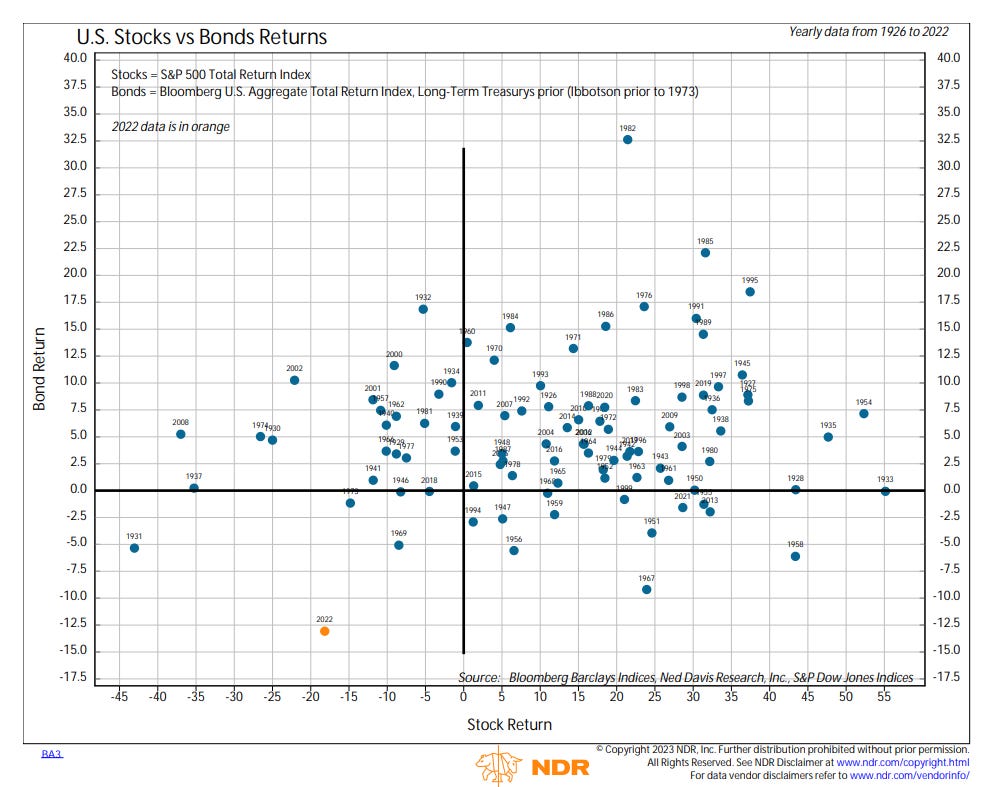
But, over the course of decades, this is not normal behavior in markets; the empirical data proves this. Especially if one extends their time horizon beyond just one year. After all, most investors are investing for longer periods of time – multiple cycles, or perhaps even decades. A quick correlation analysis confirms as much.

Investing 101 says that a mixed portfolio of 60% equities and 40% should provide you with a proper mix of risk and return as one is usually a hedge against the other. It will never be the best performer, but it will never be the worst performer. Equities provide the opportunity for capital appreciation and to outpace inflation, while bonds offer stability and (improved) yield. The blend of the two asset classes and systematic rebalancing are the keys to unlock
Another consideration is how easy it is to access this portfolio and at such low cost. You can buy the S&P 500 (60 part) and Barclays Bloomberg Agg (40 part) for just a few basis points from a number of providers (BlackRock, Vanguard, State Street, etc.), and then let time and compounding do the rest. You cannot do this when other “alternative” asset classes are included in the mix, let alone perform the necessary due diligence and ongoing maintenance that is required.

Source: Financial Times, BlackRock, J.P. Morgan Asset Management
Market sentiment remains depressed
No matter the survey, investors are apprehensive about the economy and the 2023 stock market rally.
But, interestingly enough, the list of stocks participating to the upside is getting longer, not shorter. More and more stocks, sectors, and countries around the world have been participating in this rally off the October lows.
When looking at the MSCI All Country World Index – a broad measure of U.S. stocks, international developed stocks, and international emerging stocks – nearly 80% of constituents are trading above their 50- and 200-day moving averages.
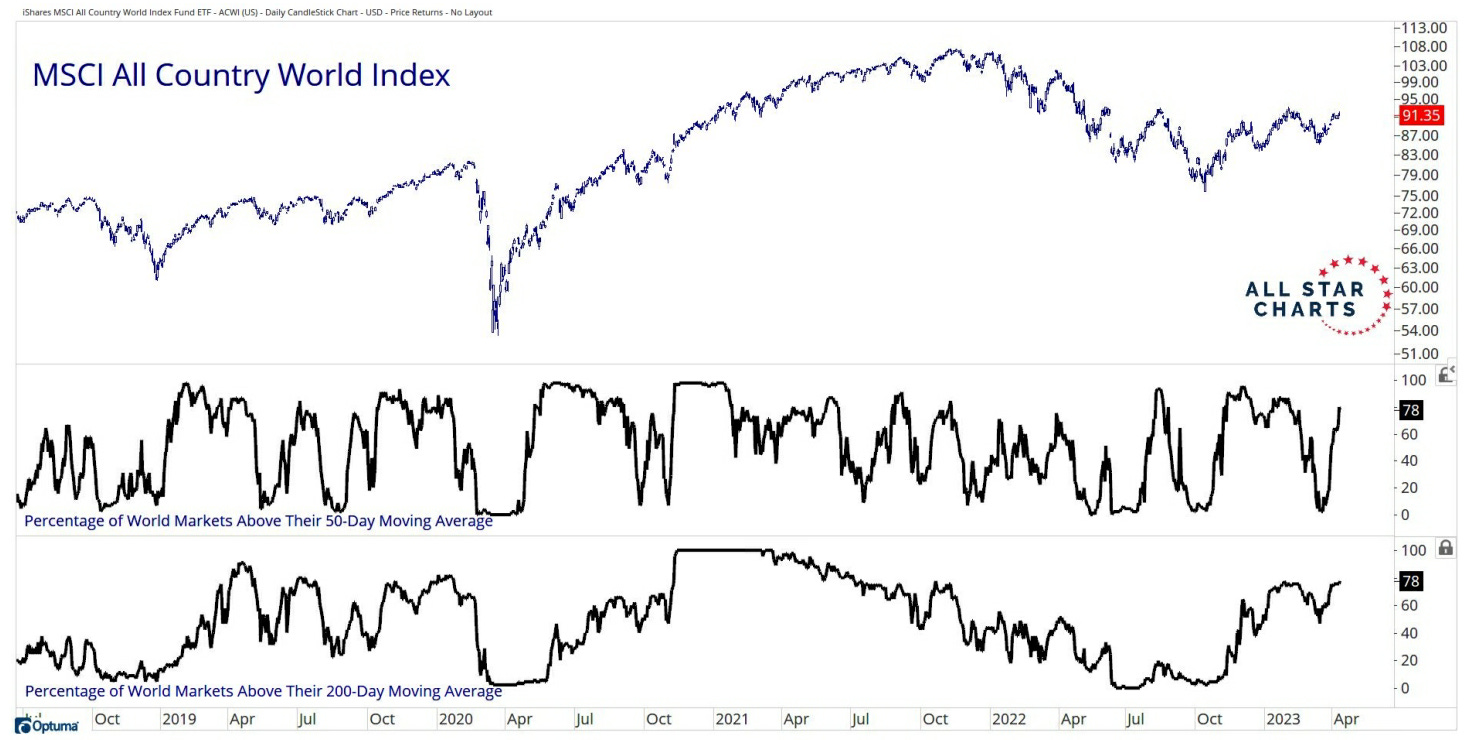
Or, if you prefer to review what stocks are making New 6 Month or 52 Week Lows, it appears none are.

I’m not a formal market technician by trade, but a simple review of various major indexes show momentum and breadth is not deteriorating.
In fact, it’s quite the opposite. If you just review price, many of the major stock average are up 20-30% off the October lows. Bear market rally? Maybe. Is the stock market wrong? I don’t know.
But it’s very obvious that investors aren’t paying close enough attention to technicals because the fundamental backdrop is so overwhelmingly skewed negative. J.P. Morgan's latest investor survey confirms as much, showing roughly 95% of respondents agreed stocks would fall in price between now and the end of the year. Another 5% or so believe stock prices stay basically where they are now. Almost none of them think prices rise this year.

Source: All Star Charts
China’s economy gathers momentum
China’s National Bureau of Statistics announced 1st quarter gross domestic product rose +4.5%, a sharp contrast to its global peers that are facing slowing growth as central banks hike rates to tame inflation. China’s stated GDP growth target for 2023 is 5%.
The rebound was led by increased infrastructure investment, strong exports, rising property prices, and the biggest monthly gain in retail sales (+10.6%) since June 2021. This was offset by weakness that remains in real estate construction.

China’s growth has been under the spotlight as it reopens after ending most of its zero-Covid restrictions that were in place for roughly three years.
Credit Karma study rings alarm bells
Per a recent study from Credit Karma, some of the bottom line takeaways in respect to Americans financial health – and their understanding of personal finances – is rather startling:
51% don’t know how to calculate their net worth
31% have net worth of $0 or less
30% of Gen Z care about celebrities’ net worth more than their own
21% aged 59 and above have net worth of $0 or less
Ignoring account statements, savings patterns, spending habits, brokerage account performance, and broader economic trends will never lead to financial independence.
Source: Credit Karma, Wall Street Journal
That’s all for today.
Blake
Welcome to The Sandbox Daily, a daily curation of relevant research at the intersection of markets, economics, and lifestyle. We are committed to delivering high-quality and timely content to help investors make sense of capital markets.
Blake Millard is the Director of Investments at Sandbox Financial Partners, a Registered Investment Advisor. All opinions expressed here are solely his opinion and do not express or reflect the opinion of Sandbox Financial Partners. This Substack channel is for informational purposes only and should not be construed as investment advice. Clients of Sandbox Financial Partners may maintain positions in the markets, indexes, corporations, and/or securities discussed within The Sandbox Daily.