

Active management underperforms, again
The Sandbox Daily (3.4.2026)

Welcome, Sandbox friends.
Today’s Daily discusses:
active management underperforms, again
Let’s dig in.
Blake
Markets in review
EQUITIES: Nasdaq 100 +1.51% | Russell 2000 +1.06% | S&P 500 +0.78% | Dow +0.49%
FIXED INCOME: Barclays Agg Bond -0.04% | High Yield +0.35% | 2yr UST 3.551% | 10yr UST 4.096%
COMMODITIES: Brent Crude +1.38% to $82.52/barrel. Gold +0.57% to $5,152.8/oz.
BITCOIN: +7.08% to $73,227
US DOLLAR INDEX: -0.29% to 98.767
CBOE TOTAL PUT/CALL RATIO: 0.96
VIX: -10.25% to 21.15
Quote of the day
“Always make room for people to go with you into your future, but never sacrifice your future for those who want you to stay exactly how you are. You need people in your life who will cheer you on as you risk and grow. You need people in your life who will celebrate your success.”
- Erwin McManus, Mind Shift
Active management underperforms, again
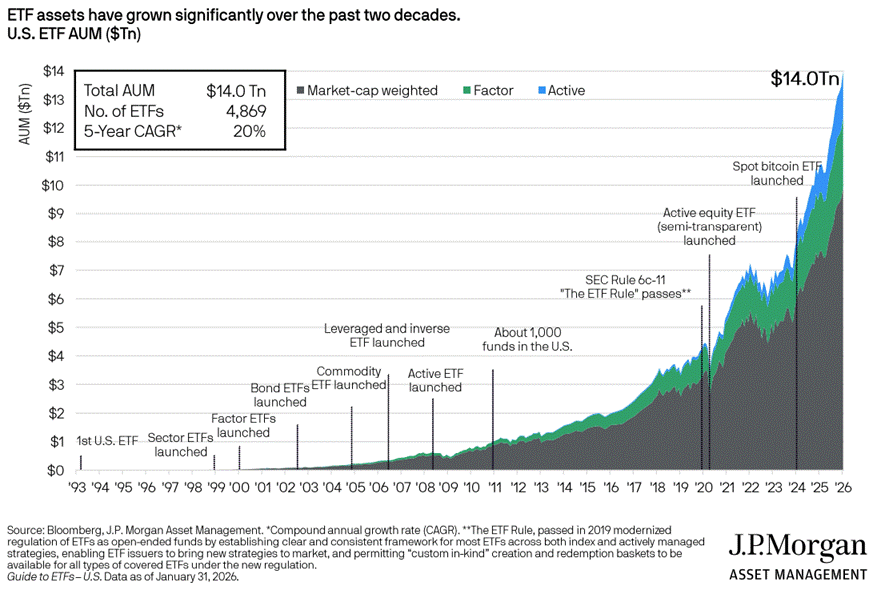
One of the most noteworthy trends in market structure this side of 2000 is the undeniable capital shift from mutual fund vehicles to exchange-traded products (ETFs).
The benefits of ETF investing are indisputable:
Transparency: Daily holdings disclosure leads to more visibility of underlying securities, better pricing during market stress, and tighter spreads
Liquidity: Exchange trading provides intra-day liquidity and constant price discovery, especially in illiquid market segments
Cost-effective: One fee structure, lower expense ratios, and fewer operational frictions translates to lower costs for investors
Tax-efficiency: In-kind redemptions reduce taxable trading activity
Accessibility: Provides access to diverse asset classes that are available to all investors, whether active or passive, with no minimum investment thresholds
These dynamics are powerful tailwinds chasing more and more assets into ETFs.
Mutual funds still hold more money than ETFs, but the gap is shrinking quickly. Today, roughly $14 trillion in assets are invested in ETFs, versus an estimated $25-$30 trillion in mutual funds.
And yet, despite the obvious benefits to owning ETF structures over mutual funds, the most powerful driver of flows continues to be, and always will be, performance.
S&P Global released their annual SPIVA scorecard that compares actively managed funds against their appropriate benchmarks so the investing public can better understand the performance of investment managers.
Two common themes have emerged over time:
Actively managed funds have historically tended to underperform their benchmark over short- and long-term time horizons.
Even when actively managed funds in a category have outperformed their benchmark over one time period, the chance of that same fund’s persistent and continued outperformance is unlikely because most have failed to do so over multiple time frames.
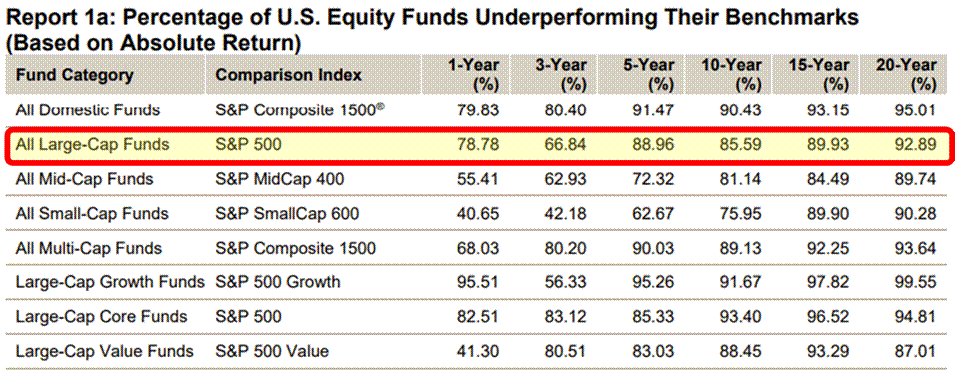
2025 was no different: 79% of all active large-cap U.S. equity funds underperformed the S&P 500 index.
That’s worse than the 65% rate observed in 2024 and the 4th worst year for active large-cap managers over the 25-year history of the SPIVA Scorecards.
The last year in which the majority of fund managers in this category beat the index was 2009. 16 consecutive years of underperformance and counting.
While dispersion was conducive to stock selection last year, large-cap PMs continue to underperform at an impressive clip.

What’s more, the underperformance results become even more apparent as the time horizon expands.
89% of fund managers underperformed the index over a 5-year time horizon.
86% over 10-years.
93% over 20-years.
The continued underperformance delivered by active managers illustrates three important takeaways for investors at home:
Performance: Outperforming the market is extremely difficult, even for professionals with significant resources at their disposal.
Fees: Active investment managers are not able to pick enough winners to justify their higher fee structure compared to passive investment structures.
Risk: Active funds often have higher Active Share by taking on different positions and/or different size exposures versus the benchmark, which often results in greater tracking error. In plain English, investors might not own what they intended to own.
**SPIVA stands for S&P Indices Versus Active
Sources: J.P. Morgan, S&P Dow Jones
That’s all for today.
Blake
Questions about your financial goals or future?
Connect with a Sandbox financial advisor – our team is here to support you every step of the way!
Welcome to The Sandbox Daily, a daily curation of relevant research at the intersection of markets, economics, and lifestyle. We are committed to delivering high-quality and timely content to help investors make sense of capital markets.
Blake Millard is the Director of Investments at Sandbox Financial Partners, a Registered Investment Advisor. All opinions expressed here are solely his opinion and do not express or reflect the opinion of Sandbox Financial Partners. This Substack channel is for informational purposes only and should not be construed as investment advice. The information and opinions provided within should not be taken as specific advice on the merits of any investment decision by the reader. Investors should conduct their own due diligence regarding the prospects of any security discussed herein based on such investors’ own review of publicly available information. Clients of Sandbox Financial Partners may maintain positions in the markets, indexes, corporations, and/or securities discussed within The Sandbox Daily. Any projections, market outlooks, or estimates stated here are forward looking statements and are inherently unreliable; they are based upon certain assumptions and should not be construed to be indicative of the actual events that will occur.
Please see additional disclosures (click here)
Please see our SEC Registered firm brochure (click here)
Please see our SEC Registered Form CRS (click here)