Apple hits all-time highs while VIX collapses
The Sandbox Daily (6.5.2023)
Welcome, Sandbox friends.
Today’s Daily discusses:
Apple hits all-time highs as it releases the mixed-reality headset, Vision Pro
VIX hits 3-year lows
what happens after the S&P 500 gains 20% off the bear market low
the narrow 2023 market, by the numbers
economic indicators still show economy is not in a recession
Let’s dig in.
Markets in review
EQUITIES: Nasdaq 100 +0.07% | S&P 500 -0.20% | Dow -0.59% | Russell 2000 -1.32%
FIXED INCOME: Barclays Agg Bond -0.01% | High Yield -0.08% | 2yr UST 4.472% | 10yr UST 3.691%
COMMODITIES: Brent Crude +0.29% to $76.35/barrel. Gold +0.41% to $1,977.7/oz.
BITCOIN: -5.12% to $25,793
US DOLLAR INDEX: +0.01% to 104.017
CBOE EQUITY PUT/CALL RATIO: 0.52
VIX: +0.89% to 14.73
Quote of the day
“Constantly compare your outcomes to your goals.”
- Ray Dalio, Principles
Apple hits all-time highs as it releases Vision Pro
Apple Inc. (AAPL) broke out to all-time highs last week on a weekly closing basis. Today, it followed up by making new all-time highs on an intraday basis.
It’s emerging from an 18-month base within a strong secular uptrend after correcting more than 30% last year, and the path of least resistance is higher as long as it’s above $180.
Keep in mind Apple is the largest stock in the S&P 500 index (representing 7.5% on the index) and 2nd largest stock in the Nasdaq 1000 Index (representing 12.26%). At $2.8 trillion, its market cap is larger than the entire Russell 2000 small-cap index.
Looking forward, Apple unveiled today in its annual Worldwide Developers Conference its long-awaited mixed-reality headset, known as Apple Vision Pro, expanding the technology giant’s unrivaled hardware-and-software ecosystem into a new realm of computing.
The high-end headset, priced at $3,499 and available early next year, may not be a major contributor to Apple’s financial success right away, but neither was the iPhone (annual revenues shown below) or the iWatch. However, this is just the 1st-generation version of this product/category, and Apple’s management and product execution over the years suggest the company will refine this new technology into a billion dollar business in the future.
Source: Apple, The Chart Report, Steve Strazza, Statista
VIX at 3-year lows
The Volatility Index (VIX) – which measures the implied expected volatility of the U.S. stock market over the next 30 days – closed on Friday of last week below 15 for the first time in the post-COVID period.
Steady uptrends in the S&P 500 index (SPX) tend to occur during low volatility regimes. Seeing the VIX at multi-year lows is further evidence that the S&P 500 index is establishing a new uptrend.
Unlike financial assets such as stocks, commodities, and bonds, which tend to trend over longer time frames, stock market volatility and the Volatility Index (VIX) tend to mean revert.
Whether or not the VIX is about to snap back with a mean-reversion rally or simply settle into a new and lower range is the big question. If the former happens, it means that some much-needed corrective action is probably underway for equities. However, if we don’t get a bounce in volatility here, the price action could begin to look a lot more like other bull market periods such as 2017 or 2019.
Source: All Star Charts
What happens after the S&P 500 gains 20% off the bear market low
The S&P 500 index is just within reach of a new bull market, at least the textbook definition that describes a 20% rise from the cycle lows.
Many investors are asking what happens next.
In the previous 13 instances since 1950 that the S&P 500 index gained 20% from the bear market lows, the market was higher 12 of 13 times and had an average gain of 17.7%. It must be noted that 3 of those instances saw the index make new lows, however – twice in the dot-come bust and once in the Global Financial Crisis.
Source: Ryan Detrick
The narrow 2023 market, by the numbers
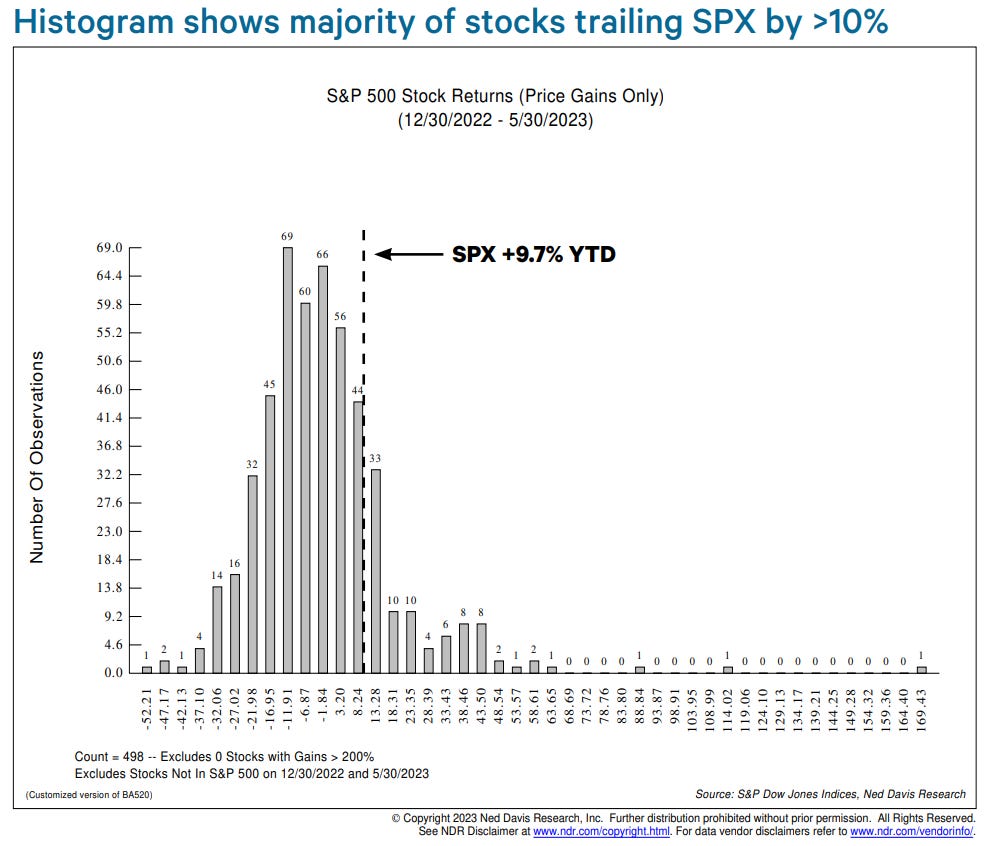
The overarching theme for the stock market in 2023 is the mean reversion in mega-cap stocks that underperformed in 2022.
This chart from Ned Davis Research shows the distribution of returns by S&P 500 stocks year-to-date through the end of May. Over half of returns are clustered between -12% and +3%. The median stock is down -1.6% versus +9.7% for the index. Only 10% of constituents are up over 20%.
This next chart shows the percentage of S&P 500 stocks that have outperformed the index on a rolling 3-month basis, which roughly corresponds to the start of the regional banking crisis. The current reading of 20.3% is a record low, dating back to 1972.
Source: Ned Davis Research
Economic indicators still show economy is not in a recession
Economic growth is gradually downshifting under the enormous weight of the Fed’s tightening cycle, yet none of the indicators that the NBER recession committee normally monitors suggest we’re in a recession at the present moment.
Source: Justin Wolfers
That’s all for today.
Blake
Welcome to The Sandbox Daily, a daily curation of relevant research at the intersection of markets, economics, and lifestyle. We are committed to delivering high-quality and timely content to help investors make sense of capital markets.
Blake Millard is the Director of Investments at Sandbox Financial Partners, a Registered Investment Advisor. All opinions expressed here are solely his opinion and do not express or reflect the opinion of Sandbox Financial Partners. This Substack channel is for informational purposes only and should not be construed as investment advice. Clients of Sandbox Financial Partners may maintain positions in the markets, indexes, corporations, and/or securities discussed within The Sandbox Daily.


