

Bad breadth, plus bear markets, shadow banking, Fed breaking things, and how to build wealth
The Sandbox Daily (3.29.2023)

Welcome, Sandbox friends.
Today’s Daily discusses:
stock market has bad breadth
history of bear markets
hidden leverage in the system
when the Fed breaks things
3 core activities to building wealth
Let’s dig in.
Markets in review
EQUITIES: Nasdaq 100 +1.87% | S&P 500 +1.42% | Russell 2000 +1.08% | Dow +1.00%
FIXED INCOME: Barclays Agg Bond +0.12% | High Yield +1.25% | 2yr UST 4.095% | 10yr UST 3.562%
COMMODITIES: Brent Crude -0.42% to $78.32/barrel. Gold -0.43% to $1,982.0/oz.
BITCOIN: +4.37% to $28,428
US DOLLAR INDEX: +0.24% to 102.676
CBOE EQUITY PUT/CALL RATIO: 0.74
VIX: -4.26% to 19.12
Quote of the day
“Once we realize that imperfect understanding is the human condition, there is no shame in being wrong, only in failing to correct our mistakes.”
-George Soros
Stock market has bad breadth
Market breadth is becoming an issue for stocks of late.
Here is the year-to-date performance heat map of all stocks trading within the S&P 500 index. The bigger the box, the larger the market-capitalization of the company and therefore the greater impact on its contribution to the index’s performance.
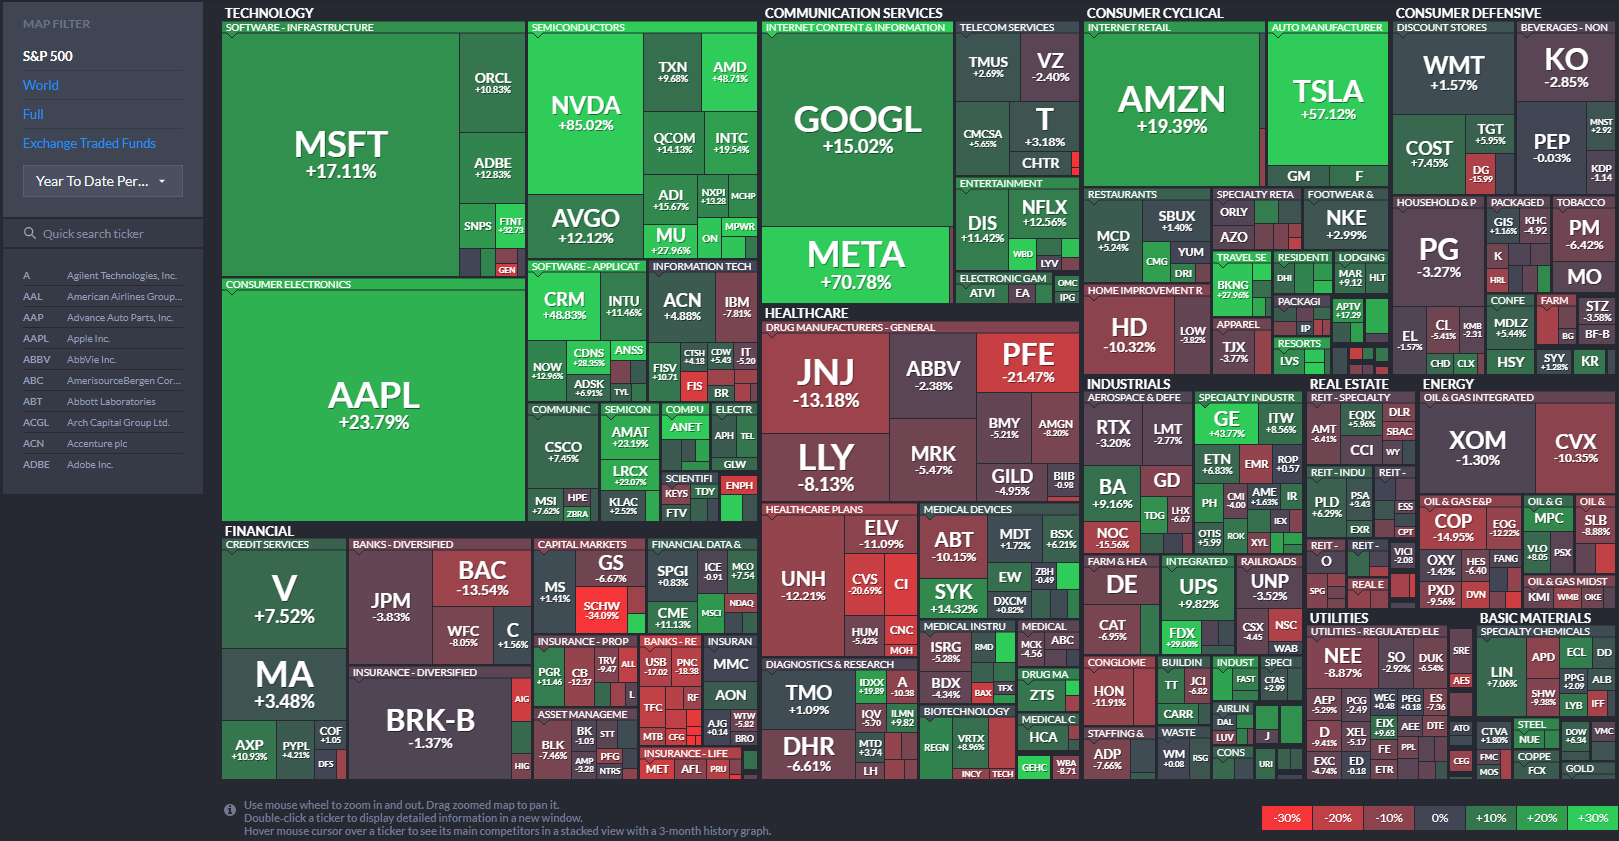
It’s clear that just a handful of mega-cap tech stocks (MSFT, AAPL, NVDA, GOOGL, META, AMZN, TSLA) are doing the heavy lifting within the S&P 500.
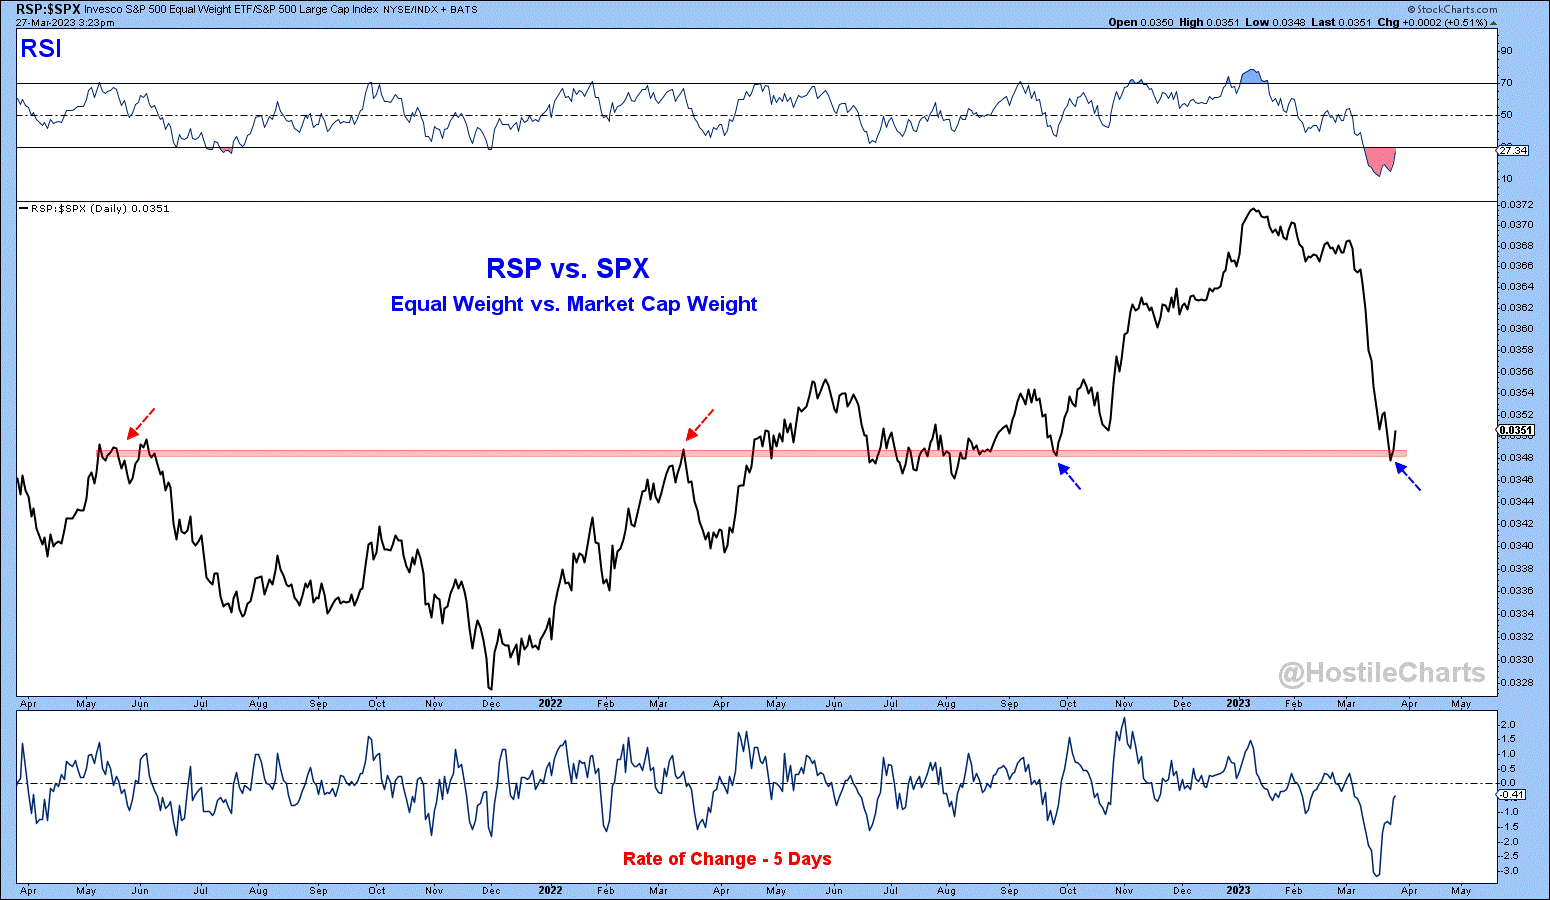
As a result, the equal-weighted S&P 500 is on track for its 2nd worst month relative to the cap-weighted S&P 500 in the past 25 years. The ratio chart below of the equal-weight S&P 500 ETF (RSP) vs. the traditional market cap-weight S&P 500 (SPX) shows relative strength has broken down rather quickly and testing potential support. This level has been a key inflection point in recent years. Bulls would welcome a bounce from this ratio, as it would represent broadening participation as opposed to the narrow mega-cap leadership we've had so far this month. Which leads us to…
The Nasdaq 100 Composite, the source of so much pain in 2022 (-32.38%), is leading the stock market averages in 2023, currently up ~17% year-to-date and hovering at the upper end of its 8-month range – having just closed at its highest level since August 25th, 2022, the day before the Jerome Powell speech in Jackson Hole that sent stocks crashing into the October lows.
Looking under the hood, however, tells a different story, as the Advance/Decline line (red line) – or the number of expanding issues less the number of declining issues – has significantly diverged from the upward trending index level (blue line). This signals a narrowing participation of stocks and a lack of confirmation in the bullish trend for the tech-heavy index. This is a bearish signal and could indicate that the uptrend has run its course and is about to reverse to the downside.
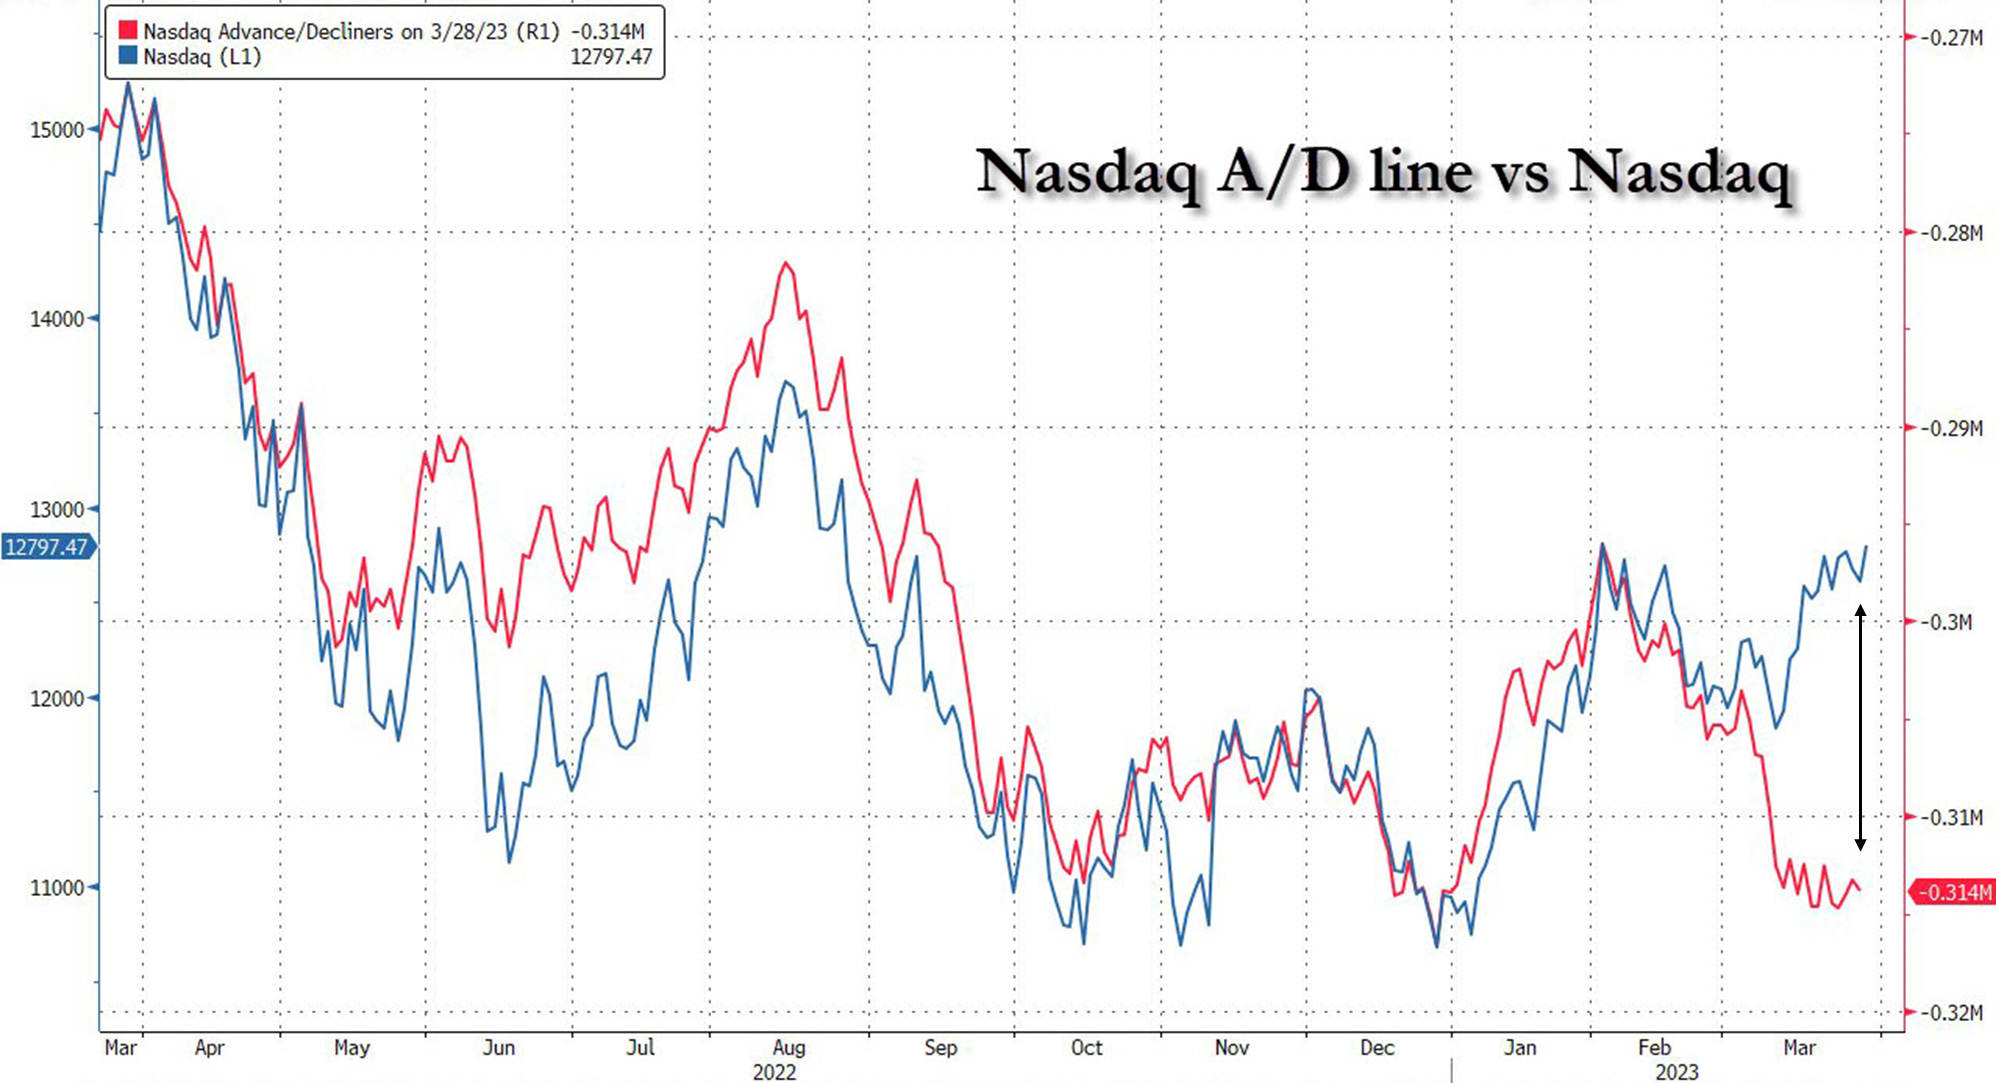
Why it matters: the Advance/Decline line often leads the broader market higher or lower so right now the breadth measure is not confirming this leg higher just yet, let alone a break higher.
As chart technician Willie Delwiche, CMT, eloquently explains:
Think of a stock market index as a ship: Breadth is the rudder and the steering happens beneath the surface. Not always immediately, but eventually.
Source: Financial Visualizations, Hostile Charts, Bespoke Investment Group, Zero Hedge, Hi Mount Research
History of bear markets
The biggest Bear Market declines have historically preceded the biggest Bull Market recoveries.
Since 1880, the S&P 500 averages a +40% 1-year return and +54% 2-year return off major Bear Market lows.
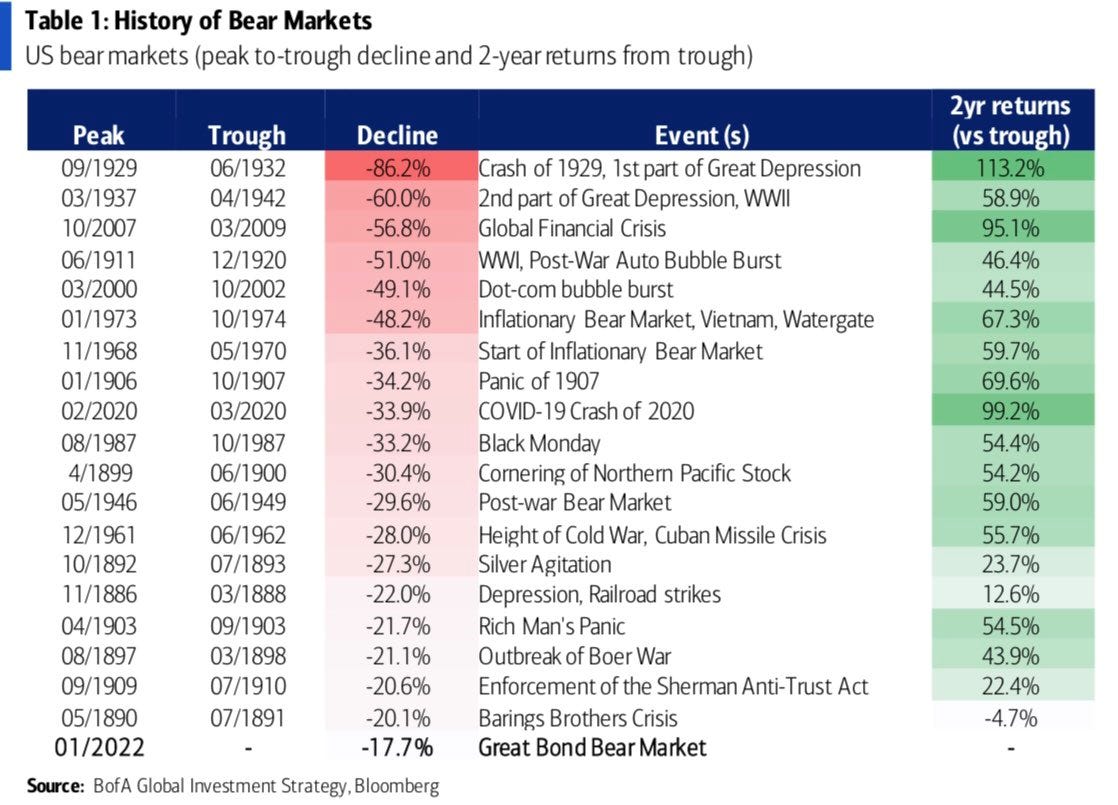
Bear Markets are incredibly difficult and frustrating to endure, especially for first time investors. For those longer tenured investors, it’s been nearly 15 years since the Global Financial Crisis so the memory bank may be a bit dusty. However, it is important to remember that Bear Markets happen with reasonable frequency and are a feature of the economic cycle, not a bug.
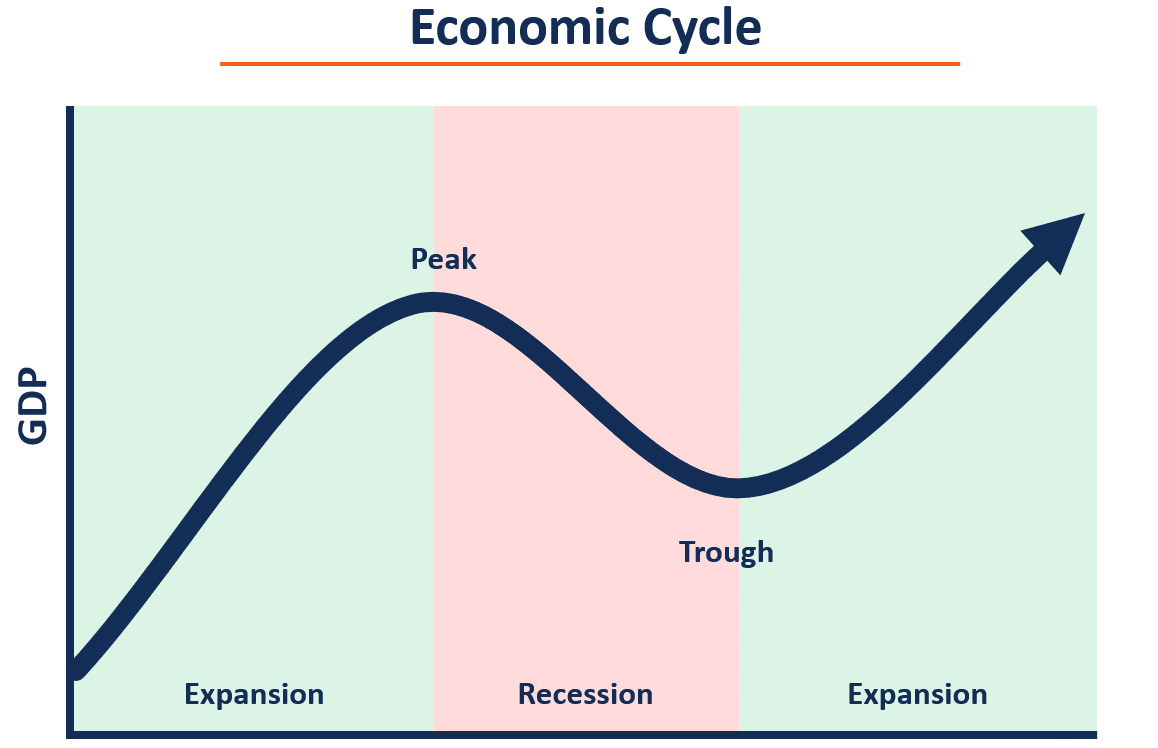
These are attractive opportunities and entry points for investors to build long-term wealth.
Source: Marlin Capital, Corporate Finance Institute
Hidden leverage in the system
More than a dozen regulators, bankers, asset managers, and former central bank officials interviewed by Bloomberg News say shadow banking debt and its links to lenders are becoming a major cause for concern as rising interest rates send tremors through financial markets.
After the heavy blitz of rules and regulations unloaded on the banks following the Great Financial Crisis in 2008-2009, much of the credit creation moved away from the traditional institutions where oversight and red tape was too cumbersome and into the “shadow banking” dark pools of capital providers.
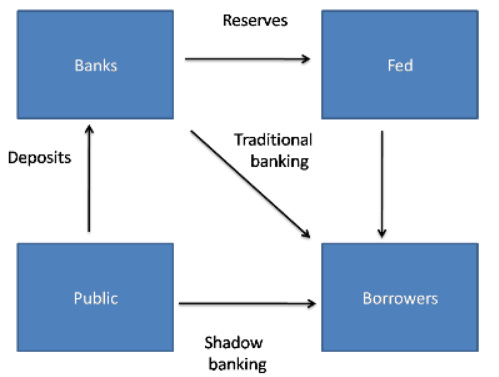
The recent turmoil across the banking sector has investors and regulators looking across the credit spectrum for contagion risks and blind spots. This has brought a spotlight to the shadow banking system where asset growth has been steady for over 20 years.
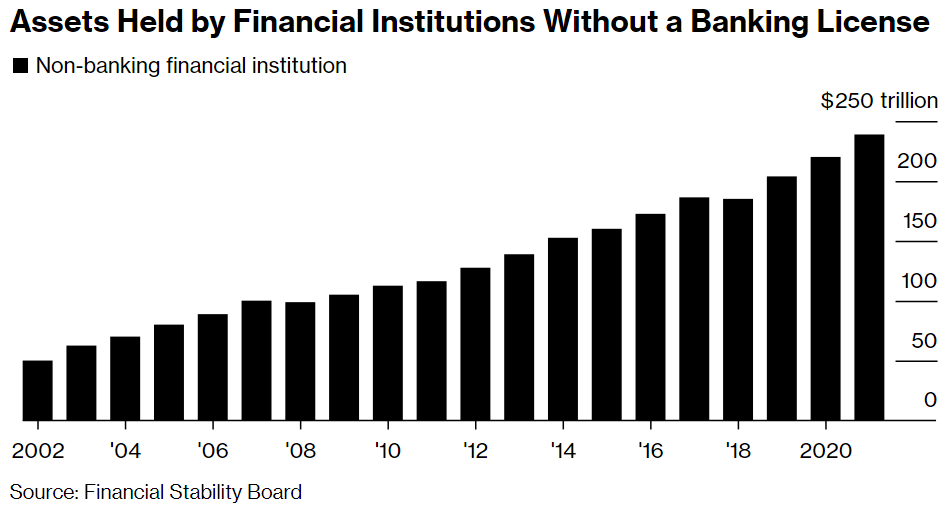
“Warning signs are developing in what is a completely unregulated segment of the financial markets with substantial amounts of hidden leverage and opaqueness,” asset manager VGI Partners Global Investments Ltd. said in a letter to investors at the end of January.
Source: International Monetary Fund, Bloomberg, New York Fed
When the Fed breaks things
History repeats itself over and over again, as Fed tightening cycles end with a major financial event.
This rate hiking cycle has “broken” a number of things: pensions in the United Kingdom, the decade+ tech boom, crypto, SPACs, regional banks, and the Credit Suisse Additional Tier 1 (AT1) bonds.
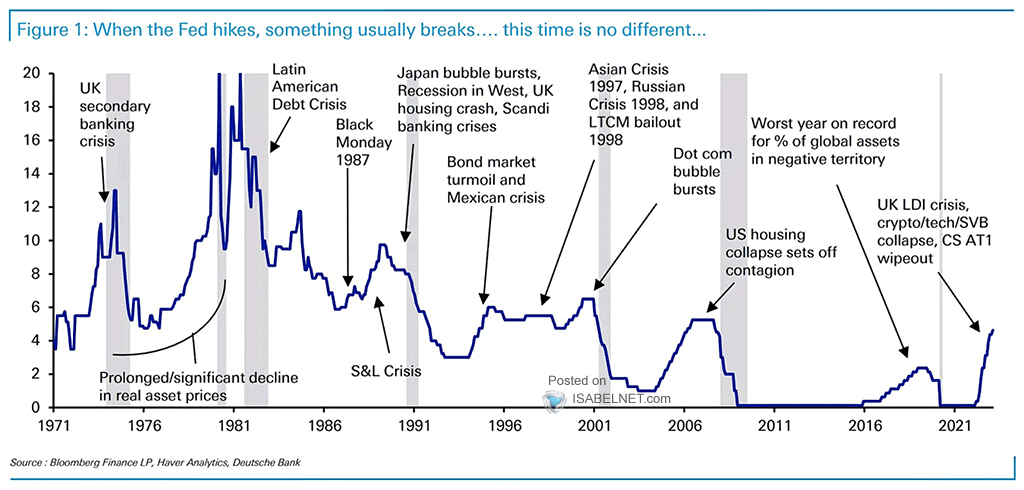
What comes next?
Source: Yardeni Quick Takes, Deutsche Bank
One simple graphic
99% of wealth creation – for the vast majority of the investing public, that is – comes from these three core activities.
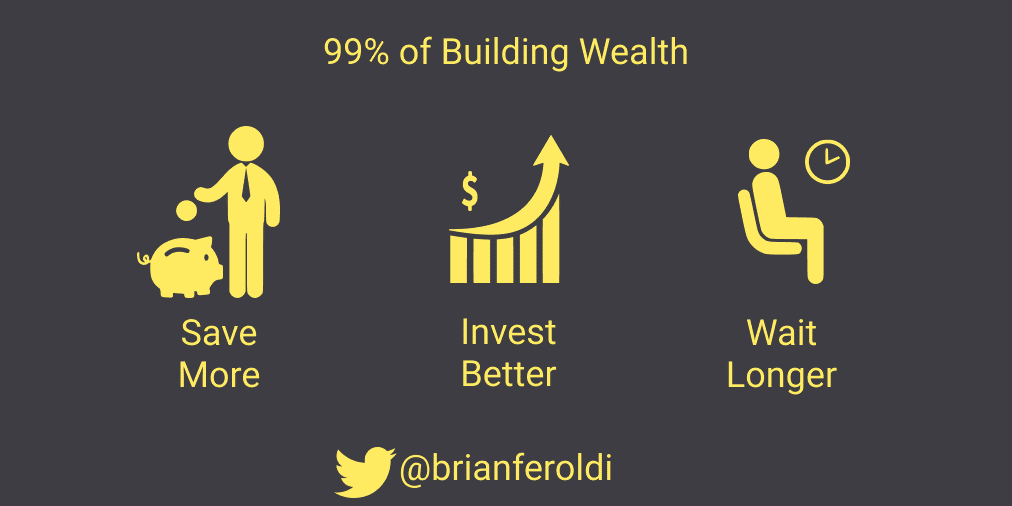
Simple, right?
Source: Brian Feroldi
That’s all for today.
Blake
Welcome to The Sandbox Daily, a daily curation of relevant research at the intersection of markets, economics, and lifestyle. We are committed to delivering high-quality and timely content to help investors make sense of capital markets.
Blake Millard is the Director of Investments at Sandbox Financial Partners, a Registered Investment Advisor. All opinions expressed here are solely his opinion and do not express or reflect the opinion of Sandbox Financial Partners. This Substack channel is for informational purposes only and should not be construed as investment advice. Clients of Sandbox Financial Partners may maintain positions in the markets, indexes, corporations, and/or securities discussed within The Sandbox Daily.