

Banks reclaim key level, plus finance IRL, equity exposure, and next upside target for S&P 500
The Sandbox Daily (7.20.2023)

Welcome, Sandbox friends.
Today’s Daily discusses:
banks reclaim important technical level
real life ≠ algorithm
NAAIM Exposure Index shows strongest positioning since 2021 Nasdaq market top
next upside target for the S&P 500
**A warm welcome to the many new subscribers joining us since yesterday’s 1-year anniversary post, especially a few subs whose opinion and professionalism I respect immensely. Welcome aboard!
Let’s dig in.
Markets in review
EQUITIES: Dow +0.47% | S&P 500 -0.68% | Russell 2000 -0.89% | Nasdaq 100 -2.28%
FIXED INCOME: Barclays Agg Bond -0.52% | High Yield -0.44% | 2yr UST 4.845% | 10yr UST 3.856%
COMMODITIES: Brent Crude +0.30% to $79.70/barrel. Gold -0.45% to $2,010.6/oz.
BITCOIN: -0.98% to $29,709
US DOLLAR INDEX: +0.55% to 100.831
CBOE EQUITY PUT/CALL RATIO: 0.48
VIX: +1.67% to 13.99
Quote of the day
“Avoid the twin impostors of short term out- and under-performance. It is important for us to remember what really matters is the long-term.”
- Howard Marks, Oaktree Capital Management
Banks reclaim some technical damage
After healthy earnings’ reports from many regional banks – at least against market expectations – the sector refuses to be left behind as upside participation expands in this impressive summer rally.
After 4 months of carving out an inverted head and shoulders formation, the SPDR Bank ETF (KBE) is piercing through neckline – repairing some major technical damage – and reaching its highest level since March when the regional banking crisis emerged.

These formations act as reversal patterns once the neckline is breached, indicating that the path of least resistance now points higher for these stocks. Holding $38-$39 means the recent trend remains intact.
The fact that even the worst-performing stocks are resolving higher from bullish reversal formations speaks to risk-seeking behavior and reinforces expanding breadth at an industry group level. The $KBE is up +13% in July alone.

This group languished for the better part of 2023 due to multiple headwinds: Fed’s higher-for-longer mandate (deposit flight + credit risk), commercial real estate fears (regionals supply 2/3 of the loans), and recession expectations (tightens credit creation).
Source: All Star Charts, State Street Global Advisors
Real life ≠ algorithm
Humans don't fit into an algorithm.
This is particularly true when we’re talking about humans and their money.
As much as we would all love a simple formula to tell us what to do with our money, the big money questions don’t fit into neat little boxes. In fact, many times the answer is “it depends.” That’s because human financial situations can be complex, confusing, and full of emotion.
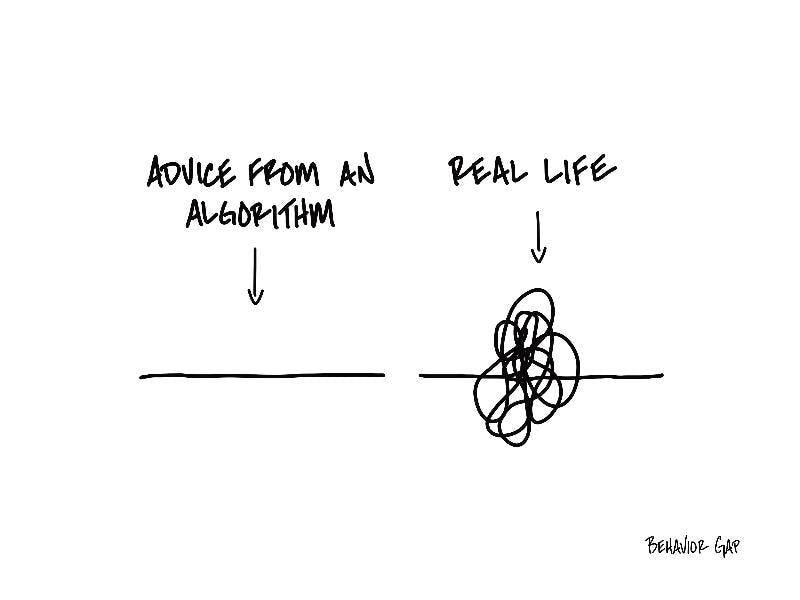
The important thing is to remain flexible and understand that life does not always move in a straight line. Things change. Circumstances change. Goals and priorities change. We change.
As Ben Carlson, CFA wrote back in 2014 on his A Wealth of Common Sense Blog, “A successful investment plan includes preparing yourself for a number of different scenarios so you don’t overreact when things don’t go as planned.”
Source: The Behavior Gap
NAAIM Exposure Index shows strongest positioning since 2021 Nasdaq market top
The National Association of Active Investment Managers (NAAIM) Exposure Index is up to 99.05 – the highest level since November 24, 2021 (103.14) when the Nasdaq Composite index just completed its all-time high on the doorstep of the 2022 bear market.
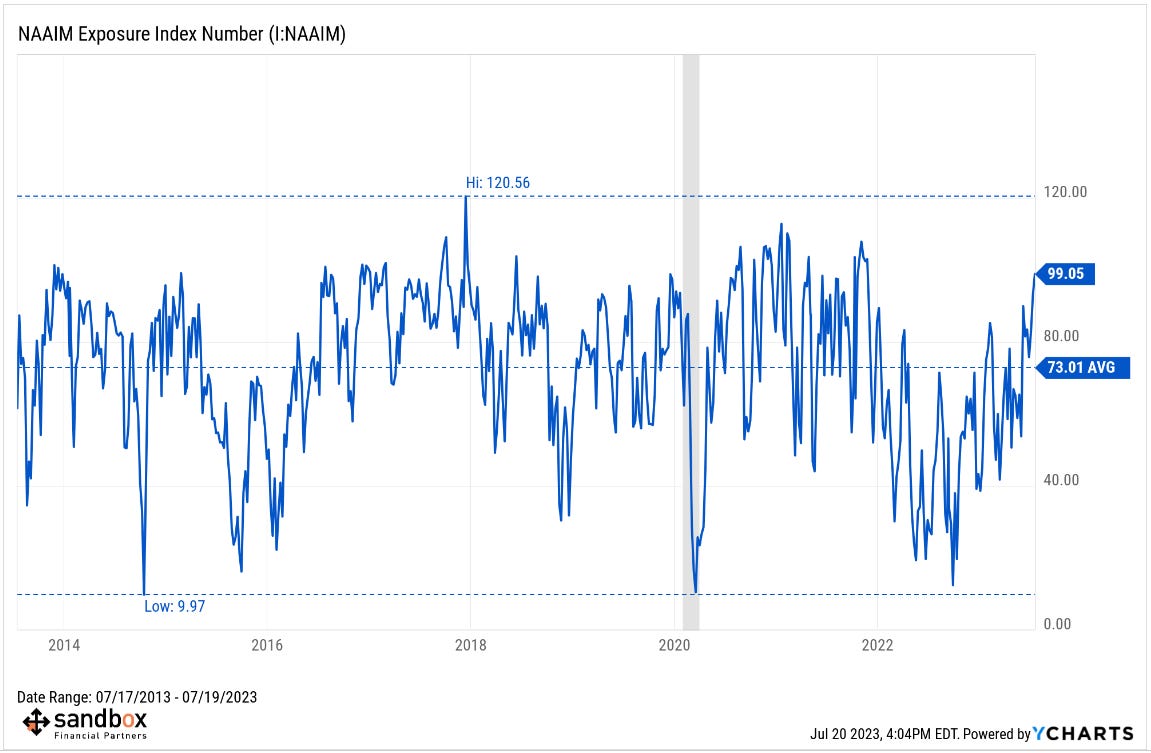
The NAAIM report shows the collective professional money manager’s weekly average exposure to equities (scaled from -200% which is leveraged short to +200% which is fully levered long).
The index has been steadily climbing higher – meaning investment managers are adding risk (i.e. legging longer into their equity positions) – following the series low of the year in March (41.92) when the regional banking crisis emerged.

Nothing like price to change sentiment and positioning.
Source: National Association of Active Investment Managers
Next upside target for the S&P 500
The next key macro event for the market is the FOMC meeting and subsequent policy announcement on Wednesday, July 26th.
In the meantime, markets will direct their attention to the 2Q23 earnings season which is already underway. With interest rates more or less rangebound and the U.S. Dollar crashing at 52-week lows, many investors are wondering what the catalyst is for the next leg up and the corresponding price target.
Last week, the S&P 500 reclaimed a very significant price level: 4,505. This is a key level as it represents a Fibonacci 76.4% retracement of the entire 2022 decline from 4,818 to 3,491. And that price action is shattering the thesis of this being merely a “bear market rally.”

For Fundstrat, and many market technicians out there, the price level of significance from here is the next Fibonacci extension in this uptrend: the January 4, 2022 intraday high of 4,819 – roughly 6% higher from here. Hard to believe that level is within our crosshairs!
Remember, Fibonacci is only a supplement to price itself that we use in order to identify the direction of the primary trend.
Source: Fundstrat, All Star Charts
That’s all for today.
Blake
Welcome to The Sandbox Daily, a daily curation of relevant research at the intersection of markets, economics, and lifestyle. We are committed to delivering high-quality and timely content to help investors make sense of capital markets.
Blake Millard is the Director of Investments at Sandbox Financial Partners, a Registered Investment Advisor. All opinions expressed here are solely his opinion and do not express or reflect the opinion of Sandbox Financial Partners. This Substack channel is for informational purposes only and should not be construed as investment advice. Clients of Sandbox Financial Partners may maintain positions in the markets, indexes, corporations, and/or securities discussed within The Sandbox Daily.