Bears take out 4300 on the S&P 500, plus China, bull steepeners, and a visit with Charles Payne
The Sandbox Daily (9.26.2023)
Welcome, Sandbox friends.
Today’s Daily discusses:
bears take out 4300 on the S&P 500 index
China’s optimism short-lived
watching for the yield curve to steepen
Let’s dig in.
Markets in review
EQUITIES: Dow -1.14% | Russell 2000 -1.27% | S&P 500 -1.47% | Nasdaq 100 -1.51%
FIXED INCOME: Barclays Agg Bond -0.13% | High Yield -0.43% | 2yr UST 5.134% | 10yr UST 4.551%
COMMODITIES: Brent Crude +0.86% to $94.09/barrel. Gold -0.91% to $1,919.0/oz.
BITCOIN: -0.39% to $26,208
US DOLLAR INDEX: +0.18% to 106.184
CBOE EQUITY PUT/CALL RATIO: 0.71
VIX: +12.07% to 18.94
Quote of the day
“The daily blips of the market are, in fact, noise -- noise that is very difficult for most investors to tune out.”
- Seth Klarman, The Baupost Group
Making Money with Charles Payne
Today, I had the pleasure of joining Charles Payne on Fox Business to talk monetary policy, the Federal Reserve, and interest rates.
Check out the clip below:
Source: Charles Payne (courtesy of Fox Business)
Bears take out 4300 on the S&P 500
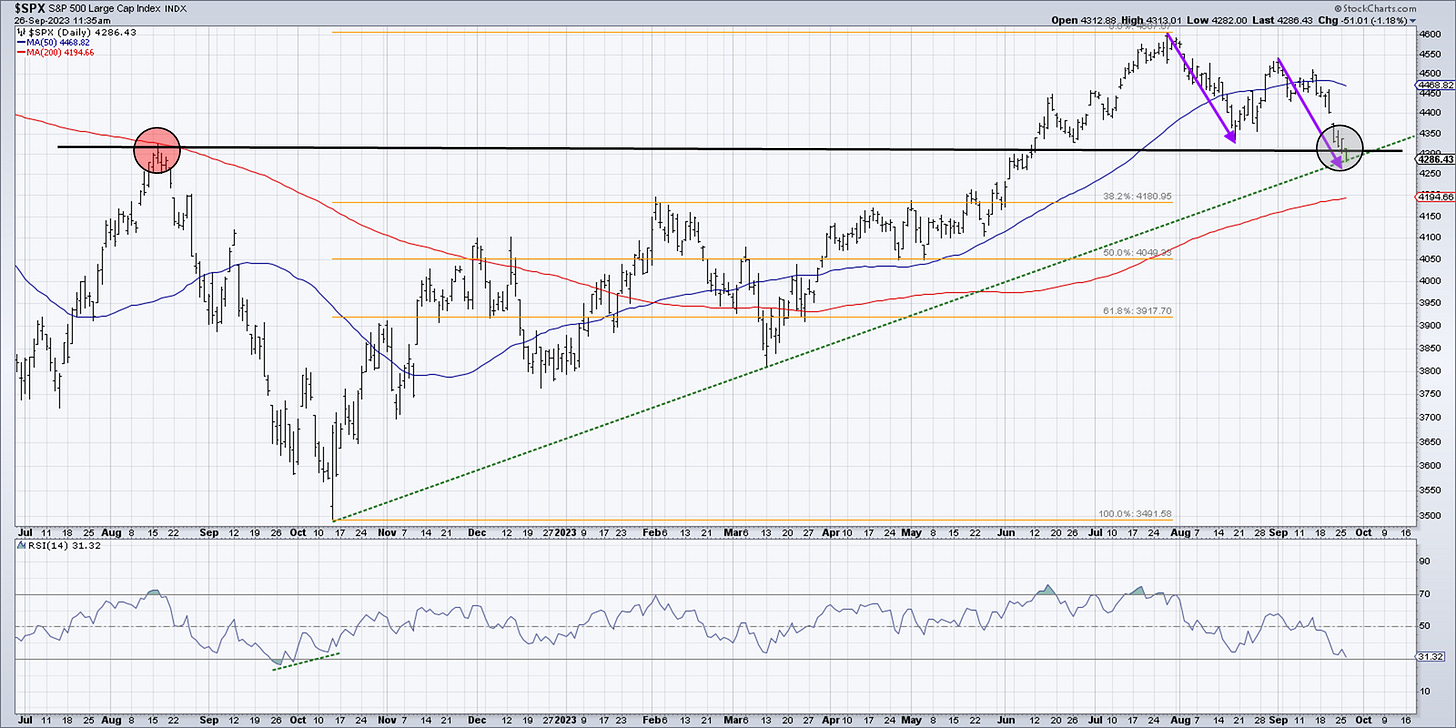
Stocks are resolving decidedly lower.
The latest catalyst? An incrementally more hawkish Fed that we saw during last week’s FOMC meeting and the committee’s updated Summary of Economic Projections demonstrating the “higher-for-longer” upside risk to interest rates.
With today’s price action, the market took out 4300 on the S&P 500 (the black horizontal line at the top of the chart below) and a key line in the sand from those August 2022 highs – flipping a key support level now into overhead resistance.
The bears have regained momentum amidst this orderly selloff since July.
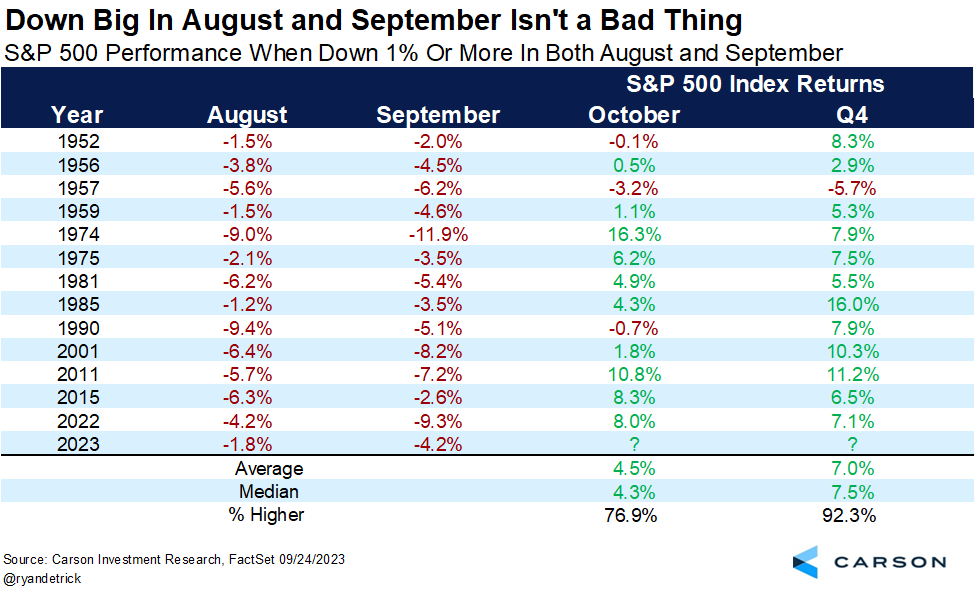
But, as Ryan Detrick of Carson Group notes in the chart below, all hope is not lost. Despite markets softening during the weakest seasonal period on the calendar (August-September), the 4th quarter could swing the market’s momentum back in the bull’s favor.
When stocks are down more than 1% in both August and September, 4th quarter returns have moved higher 12 of the past 13 times.
Source: Ryan Detrick
China’s optimism short-lived
A story that gained traction earlier this year turned out to be more hope than substance.
The hope was that China’s relaxation of its draconian zero-COVID policies would spark growth in the domestic economy and therefore help its stock market recover the losses suffered from its 2021 highs. But, an old adage comes to mind here that says to “buy the rumor, sell the news.”
As represented by the iShares China Large-Cap ETF (FXI), there was a monster 60% rally over just a few months as investors bought the rumor. Since the reopening though, it has been nothing but selling the news.
China's economic activity data over recent months – consumer spending, industrial output, real estate, exports, and unemployment – all tell the same story of a stagnant economy in decline.
Source: David Rath
Watching for the yield curve to steepen (be patient, this market note is quite technical)
The 3-month/10-year U.S. Treasury yield curve has been inverted for 216 consecutive trading days, the longest streak since at least 1960. This means short-term rates are higher than long-term rates.
In bond lingo, a yield curve inversion coupled with increasing bond yields is called a bear steepener. Bear, denoting the direction of bond prices. Steepener, describing the shape of the yield curve (long-term rates rising faster than short-term rates).
Yield curve inversions lead to recessions. However, they are poor timing signals.
As shown in the chart below, the stock market tends to do well during bear steepeners – the gray-shaded areas in the top pane below.
This bear steepening is the current environment that we find ourselves with the U.S. Treasury curve.
As Ned Davis Research puts it:
Bear steepeners have seen the strongest risk-on behavior. The macro message is that the economy is strengthening, and the Fed is expected to hike. Put another way, the economy is getting the all-clear message, but the Fed has not overtightened.
Bear steepeners find the S&P 500 rising at a 9.5% annualized rate on average, however this interest rate dynamic is the least common of all yield curve regimes – occurring about 10% of the time.
Source: Ned Davis Research
That’s all for today.
Blake
Welcome to The Sandbox Daily, a daily curation of relevant research at the intersection of markets, economics, and lifestyle. We are committed to delivering high-quality and timely content to help investors make sense of capital markets.
Blake Millard is the Director of Investments at Sandbox Financial Partners, a Registered Investment Advisor. All opinions expressed here are solely his opinion and do not express or reflect the opinion of Sandbox Financial Partners. This Substack channel is for informational purposes only and should not be construed as investment advice. The information and opinions provided within should not be taken as specific advice on the merits of any investment decision by the reader. Investors should conduct their own due diligence regarding the prospects of any security discussed herein based on such investors’ own review of publicly available information. Clients of Sandbox Financial Partners may maintain positions in the markets, indexes, corporations, and/or securities discussed within The Sandbox Daily. Any projections, market outlooks, or estimates stated here are forward looking statements and are inherently unreliable; they are based upon certain assumptions and should not be construed to be indicative of the actual events that will occur.


Great tv spot - appreciate the perspective.
Love Charles - great guest spot !