Bond market on the move, plus earnings, 6-mo TSY bill, Chinese subway data, and 4 basic tenets
The Sandbox Daily (3.2.2023)
Welcome, Sandbox friends.
Today’s Daily discusses:
bond market catches up to the Fed
earnings season update
60-40 portfolio back in the spotlight
Chinese subway usage is soaring
4 basic tenets of personal finance
Let’s dig in.
Markets in review
EQUITIES: Dow +1.05% | Nasdaq 100 +0.89% | S&P 500 +0.76% | Russell 2000 +0.22%
FIXED INCOME: Barclays Agg Bond -0.21% | High Yield +0.12% | 2yr UST 4.889% | 10yr UST 4.062%
COMMODITIES: Brent Crude +0.14% to $84.43/barrel. Gold -0.18% to $1,842.1/oz.
BITCOIN: -0.47% to $23,458
US DOLLAR INDEX: +0.47% to 104.975
CBOE EQUITY PUT/CALL RATIO: 0.97
VIX: -4.81 % to 19.59
Quote of the day
“Checklists remind us of the minimum necessary steps and make them explicit. They not only offer the possibility of verification but also instill a kind of discipline of higher performance.”
-Atul Gawande, The Checklist Manifesto
Bond market catches up to the Fed
Heading into the Federal Reserve’s February 1st FOMC policy meeting, the market expected a peak Fed Funds “terminal” rate – the level at which the Fed ultimately sets as its target for the rate hiking cycle – of around 4.75-4.87%.
Furthermore, the market also priced only one or two additional small 0.25% rate hikes at the March and May Fed meetings, before reversing course and cutting rates to 4.25% by year-end.
Now, the market is expecting the year-end Fed Funds rate at 5.25%.
So, on the heels of strong economic data in just the last 4 weeks, the bond market has shifted the terminal rate higher by roughly a full percentage point to catch up to where the Fed has stated it wants the terminal rate – above 5%.
As a result, stocks suffered, sentiment waned, and the outlook remains cloudy.
Source: Willie Delwiche, CME FedWatch Tool
Earnings season update
The performance of S&P 500 companies continues to underwhelm, although perhaps better-than-feared, as we approach the end of Q4 earnings season.
Of the ~98% of companies in the S&P 500 that have reported Q4 earnings, 68% have reported actual EPS above estimates, which is below the 5-year average of 77% and below the 10-year average of 73%.
In aggregate, companies are reporting earnings that are +1.2% above estimates, which is below the 5-year average of +8.6%, and below the 10-year average of +6.4%.
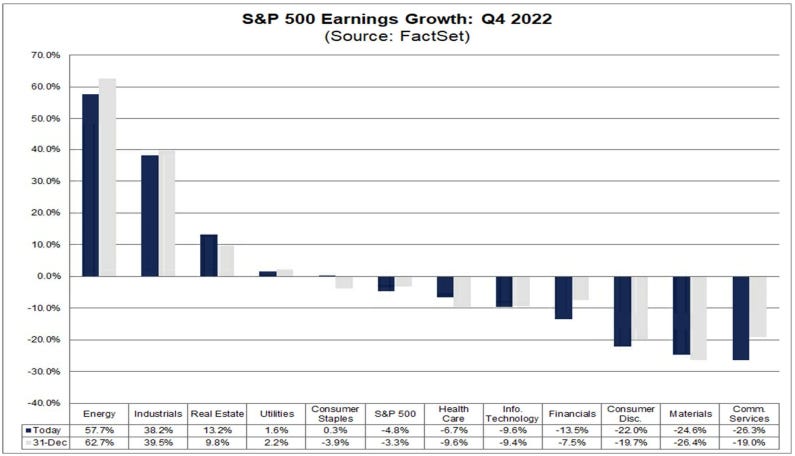
The blended earnings decline (blended combines actual results for companies that have reported and estimated results for companies that have yet to report) for the 4th quarter is -4.9% today. If -4.9% holds as the actual decline for the quarter, it will mark the first time the index has reported a year-over-year decrease in earnings since Q3 2020 (-5.7%).
5 of the 11 sectors are reporting earnings growth YoY, led by the Energy and Industrials sectors. On the other hand, 6 sectors are reporting a YoY decline in earnings, led by the Communication Services, Materials, and Consumer Discretionary sectors.
Source: FactSet
60-40 portfolio back in the spotlight
With the six-month Treasury bill rising to 5.2% - the most since 2007 – the risk-free and short-term debt obligation of the United States is now greater than the 5.1% yield on the classic mix of U.S. stocks and bonds for the first time since 2001, using the S&P 500 and Bloomberg U.S. Aggregate Bond Index as proxies.
The steep jump in those payouts has reduced the incentive for investors to take risks.
Source: Bloomberg
Chinese subway usage is soaring
China’s recovery from ending zero-COVID has been smoother than anticipated, according to timely and high frequency data.
In line with the marked improvement in services growth, consumer mobility data show that the population is engaging significantly more with the economy. Subway passenger volume is now at its highest point since October 2021, and at levels in line with the pre-COVID period.
More and more hard and soft data emerging from China in the last few months show its economy continues to accelerate more robustly than much of the market had originally anticipated.
Source: Ned Davis Research
One simple graphic
Keep it simple, stupid!
Source: Michael Kitces
That’s all for today.
Blake
Welcome to The Sandbox Daily, a daily curation of relevant research at the intersection of markets, economics, and lifestyle. We are committed to delivering high-quality and timely content to help investors make sense of capital markets.
Blake Millard is the Drector of Investments at Sandbox Financial Partners, a Registered Investment Advisor. All opinions expressed here are solely his opinion and do not express or reflect the opinion of Sandbox Financial Partners. This Substack channel is for informational purposes only and should not be construed as investment advice. Clients of Sandbox Financial Partners may maintain positions in the markets, indexes, corporations, and/or securities discussed within The Sandbox Daily.


