Breaking down S&P 500 YTD returns, plus 100 trading days, TSA screenings, cash flows, and the immigrant workforce
The Sandbox Daily (5.30.2023)
Welcome, Sandbox friends.
Over the weekend, The White House and House Speaker Kevin McCarthy reached a tentative debt ceiling deal that would suspend our nation’s borrowing limit for two years and include modest federal spending cuts; the 99-page Fiscal Responsibility Act goes to a vote on Wednesday. The announcement in principle effectively kicks the can down the road to 2025, past the national election next November. The debt ceiling deal is a positive for market and business risk sentiment, though consensus expectations had always revolved around a last-minute agreement.
Today’s Daily discusses:
breaking down the S&P 500 YTD returns
the 2023 market is now 100 trading days old
TSA screenings for Memorial Day Weekend 2023 surpass 2019 levels
cash flow cheat sheet
immigrant workforce reaches a new high
Let’s dig in.
Markets in review
EQUITIES: Nasdaq 100 +0.40% | S&P 500 0.00% | Dow -0.15% | Russell 2000 -0.32%
FIXED INCOME: Barclays Agg Bond +0.67% | High Yield +0.43% | 2yr UST 4.461% | 10yr UST 3.694%
COMMODITIES: Brent Crude -4.39% to $73.69/barrel. Gold +0.74% to $1,977.6/oz.
BITCOIN: +0.56% to $27,855
US DOLLAR INDEX: -0.13% to 104.069
CBOE EQUITY PUT/CALL RATIO: 0.53
VIX: -2.73% to 17.46
Quote of the day
“It is better to be roughly right than precisely wrong.”
- John Maynard Keynes
Breaking down the S&P 500 YTD returns
The S&P 500 index closed last week above the key 4200 level, marking a fresh 9-month high and returning ~9% year-to-date.
96% of this year’s S&P 500 return contribution is coming from its 10 largest constituents. No other up years for the S&P 500 index come even close, except 2007. Narrow markets are not always the healthiest markets.
To be clear, there are more than 5-10 stocks going higher under the hood, but they do not really matter in regards to moving the index because their contribution to the overall return is relatively small.
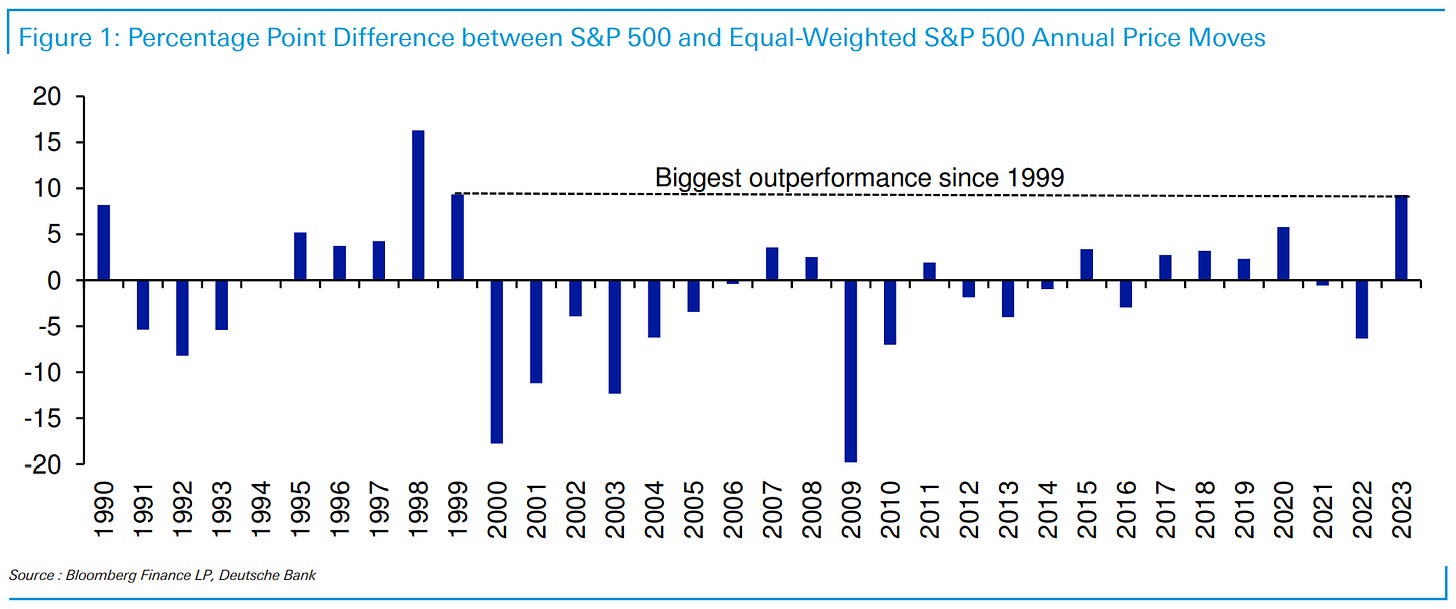
You can clearly see this when comparing the market-cap weighted index versus its equal-weighted counterpart. The cap-weighted index is outperforming its equal-weighted peer by over 9%, the biggest difference since 1999.
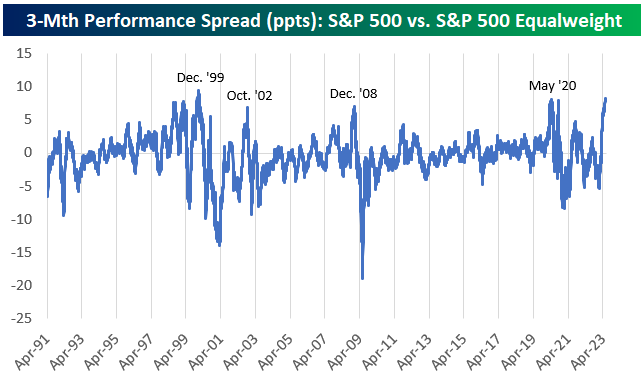
The 3-month performance spread between the two is the widest it’s been since December 1999, the move largely beginning with the fallout from the regional banking mini crisis from March.
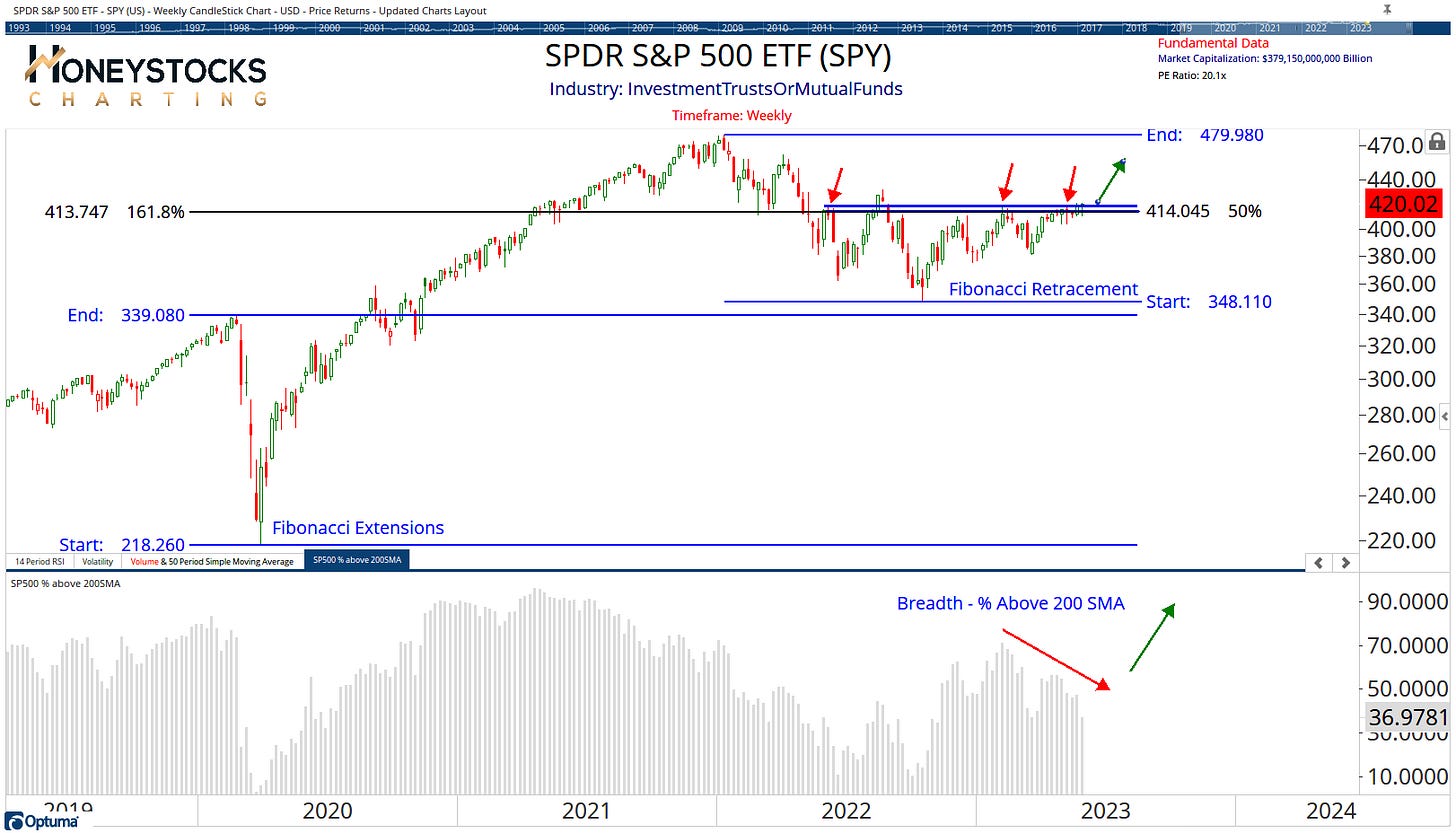
So, what comes next for the S&P 500 cap-weighted index? Bulls would like to see breadth expand with broader participation beyond the mega-cap tech names; currently just ~37% of constituents within the index are trading above their 200 day-moving average (DMA).
Source: Todd Sohn, Bespoke Investment Group, Honeystocks Charting
The 2023 market is now 100 trading days old
Thursday of last week marked the 100th trading day of the year. As of Thursday, the S&P 500 index was up +7%; the index is now trading up +9.5% YTD as of today.
What happens the rest of the year when SPX is >7% on day 100? The index is up another +9.4% on average for the remaining portion of the year and higher ~89% of time.
Source: Carson Group
TSA screenings for Memorial Day Weekend 2023 surpass 2019 levels
Memorial Day Weekend 2023 air travel surpassed pre-Covid pandemic levels, showing how consumers continue to travel despite persistent inflation.
The Transportation Security Administration (TSA) screened 9.79 million people from Friday through Monday, up roughly 300,000 people from the holiday weekend in 2019. Friday’s screening of 2.74 million people was a post-pandemic record.
Source: Transportation Security Administration, CNBC
Cash flow cheat sheet
Cash is the lifeblood of any business.
Understanding how a business manages their cash flow is one key component when analyzing a stock’s performance.
Source: The Finance Gem
Immigrant workforce reaches a new high
The share of foreign-born workers in the U.S. labor force reached a record high last year at 18.1%. With more Americans aging out of the workforce than entering into it — and at a time of labor shortages — immigrants are playing an increasingly crucial role in the labor market.
The number of foreign-born workers in the U.S. increased from 27.9 million to 29.8 million in 2022, a jump of ~6%, while the number of native-born workers went from 133.2 million to 134.5 million — up just 1%.
The share of foreign-born people in the workforce has been steadily rising for decades, but dipped during the pandemic — making last year's uptick look a bit more striking than it is, said Abraham Mosisa, a senior economist at the Bureau of Labor Statistics.
Source: Axios
That’s all for today.
Blake
Welcome to The Sandbox Daily, a daily curation of relevant research at the intersection of markets, economics, and lifestyle. We are committed to delivering high-quality and timely content to help investors make sense of capital markets.
Blake Millard is the Director of Investments at Sandbox Financial Partners, a Registered Investment Advisor. All opinions expressed here are solely his opinion and do not express or reflect the opinion of Sandbox Financial Partners. This Substack channel is for informational purposes only and should not be construed as investment advice. Clients of Sandbox Financial Partners may maintain positions in the markets, indexes, corporations, and/or securities discussed within The Sandbox Daily.


