

Budget deficit, plus househould net worth, recent S&P 500 losses, positioning and sentiment, and Bill Ackman
The Sandbox Daily (10.23.2023)

Welcome, Sandbox friends.
Today’s Daily discusses:
budget deficit swells in Fiscal Year 2023
Americans’ net worth surged by record 37% from 2019-2022
$3.5 trillion in SPX losses since “recession” revision in Fed forecast
despite bond market woes, positioning and sentiment aren’t disastrous (yet)
one manager closes very public short position “in size”
Let’s dig in.
Markets in review
EQUITIES: Nasdaq 100 +0.30% | S&P 500 -0.17% | Dow -0.58% | Russell 2000 -0.89%
FIXED INCOME: Barclays Agg Bond +0.39% | High Yield +0.40% | 2yr UST 5.047% | 10yr UST 4.848%
COMMODITIES: Brent Crude -1.92% to $90.39/barrel. Gold -0.48% to $1,972.9/oz.
BITCOIN: +9.87% to $32,892
US DOLLAR INDEX: -0.53% to 105.603
CBOE EQUITY PUT/CALL RATIO: 0.76
VIX: -6.17% to 20.37
Quote of the day
“Risk is multi-dimensional and comes in all shapes and sizes. As any good trader or investment manager will tell you, even though you think that you have portfolio risk nailed down, the market will find a way to hurt you in a way that you will not have anticipated.”
- Cam Hui, Qwest Investment Fund Management Ltd.
Budget deficit swells in Fiscal Year 2023
The federal government posted a budget deficit of $171.0 billion in September, about in line with the estimate from the Congressional Budget Office (CBO). For fiscal year 2023, the deficit was $1.695 trillion, up +23.3% from 2022. It represented 6.4% of GDP, the biggest share since 2012 (excluding the pandemic).
In its mid-session review back in July, the Treasury projected the budget deficit to continue to swell in FY 2024, reaching $1.877 trillion. The increased issuance of government securities to finance the budget deficit and debt is one factor exerting upward pressure on bond yields.

Government outlays edged down 2.2% from a year ago, largely as a result of reduced spending on income security and health. In contrast, spending on Social Security and Medicare each picked up by double digits from a year ago. Defense spending also increased at a faster clip.
The steepest YoY increase was in net interest payments, which surged a near-record 38.7%. They accounted for 10.7% of total government outlays, the biggest share since 2001. The CBO projects that, under current laws, net interest payments will continue to grow over the next decade, both as a share of outlays and as a share of GDP – raising concerns about fiscal sustainability.

Source: Ned Davis Research
Americans’ net worth surged by record 37% from 2019-2022
The Federal Reserve released their Survey of Consumer Finances report, conducted every three years and one of the primary sources of information on the financial condition of U.S. households. The data was collected from surveys between March and December 2022.
The median net worth for the typical U.S. household grew 37% to $192,900 after inflation from 2019 to 2022, the highest on record – fueled by higher home prices, investment account balances, and pandemic-era stimulus payments.

Per Ben Carlson, the change during 2019-2022 is the biggest increase over a three-year period in the history of the data set:

Meanwhile, the percentage share of American households that own stock either in mutual funds, retirement accounts, or as individual shares hit a new high at 58% in 2022 – greater than the previous high-water marks of 53% during the dot-com boom and pre-Global Financial Crisis.

Source: Federal Reserve, Survey of Consumer Finances, Barron’s, Axios, Ben Carlson
$3.5 trillion in SPX losses since “recession” revision in Fed’s forecast
The S&P 500 index has shaved $3.5 trillion dollars in market value since the Federal Reserve staff removed “recession” from their forecast.


Also, near the lows of today’s session, the market was trading within 1% from a technical correction, or a -10% drop from the July 27th intra-day high.
Source: The Kobeissi Letter, Federal Reserve, Bloomberg
Despite bond market woes, positioning and sentiment aren’t disastrous (yet)
The National Association of Active Investment Managers (NAAIM) Exposure Index (ahem) rose last week from 45.80 to 66.67 despite the market pressure. Clearly, this group is expecting a year-end rally and doesn’t reflect the same fear as the VIX or the pressure seen in the average stock.
The NAAIM report shows the collective professional money manager’s weekly average exposure to equities (scaled from -200% which is leveraged short to +200% which is fully levered long).

Shifting to sentiment, the most recent AAII Sentiment Survey showed the percentage of bullish investors declined from 40% to only 34%, just below the historical long-term average of 37.5%. Meanwhile, bearish investors declined to 34.6 which remains just above the long-term average of 31.0%.

Taken together, neither indicator seems to reflect the increasing risks from the unrelenting backup in longer-term yields, fiscal/supply concerns, continued escalation of Middle East tensions, rising energy prices, the Speakership debacle, and narrow market leadership.
Source: National Association of Active Investment Managers, Dwyer Strategy, American Association of Individual Investors
Bill Ackman closes TSY short position
Bill Ackman of Pershing Square Capital Management announced this morning that his firm covered their very public short position in long-term Treasurys. Pershing was “short in size.”
In closing his bearish bet, Ackman stated “there is too much risk in the world.”
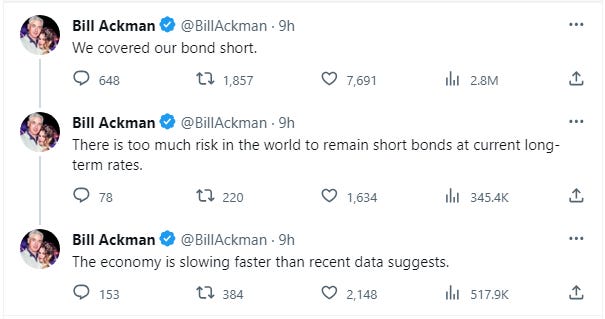
The billionaire’s public comments coincided with the peak in yields this morning, marking a swift turning point and major slide in yields during the remainder of the session.

Source: Bill Ackman, Bloomberg, The Kobeissi Letter
That’s all for today.
Blake
Welcome to The Sandbox Daily, a daily curation of relevant research at the intersection of markets, economics, and lifestyle. We are committed to delivering high-quality and timely content to help investors make sense of capital markets.
Blake Millard is the Director of Investments at Sandbox Financial Partners, a Registered Investment Advisor. All opinions expressed here are solely his opinion and do not express or reflect the opinion of Sandbox Financial Partners. This Substack channel is for informational purposes only and should not be construed as investment advice. The information and opinions provided within should not be taken as specific advice on the merits of any investment decision by the reader. Investors should conduct their own due diligence regarding the prospects of any security discussed herein based on such investors’ own review of publicly available information. Clients of Sandbox Financial Partners may maintain positions in the markets, indexes, corporations, and/or securities discussed within The Sandbox Daily. Any projections, market outlooks, or estimates stated here are forward looking statements and are inherently unreliable; they are based upon certain assumptions and should not be construed to be indicative of the actual events that will occur.