

By most measures, stocks are expensive
The Sandbox Daily (10.14.2025)

Welcome, Sandbox friends.
Today’s Daily discusses:
by most measures, stocks are expensive
Let’s dig in.
Blake
Markets in review
EQUITIES: Russell 2000 +1.38% | Dow +0.44% | S&P 500 -0.16% | Nasdaq 100 -0.69%
FIXED INCOME: Barclays Agg Bond +0.16% | High Yield +0.11% | 2yr UST 3.479% | 10yr UST 4.026%
COMMODITIES: Brent Crude -1.77% to $62.20/barrel. Gold +0.48% to $4,152.7/oz.
BITCOIN: -2.98% to $112,559
US DOLLAR INDEX: -0.21% to 99.056
CBOE TOTAL PUT/CALL RATIO: 0.81
VIX: +9.35% to 20.81
Quote of the day
“One of the most powerful ways to increase your savings isn’t to raise your income. It’s to raise your humility.”
- Morgan Housel
By most measures, stocks are expensive
No matter how many ways you slice the data, U.S. stocks are expensive.
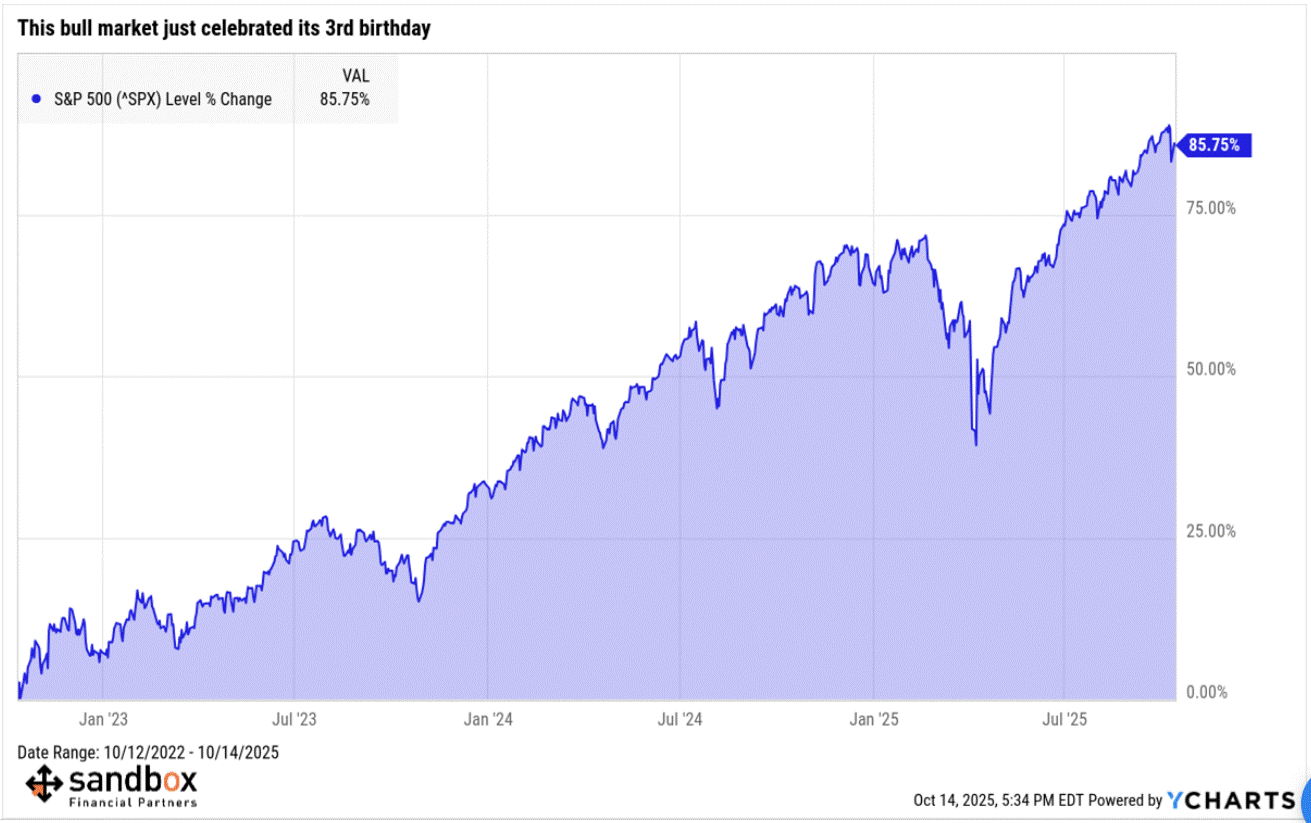
The S&P 500 Index is up 85% from its October 2022 bear market low, while earnings are higher by ~20%.
It’s no wonder, then, that valuations have risen.
The most common pushback to comparing market multiples over time, think P/E or P/S, is that they don’t take into account structural changes across the economy, profit margins of the largest stocks, leverage/credit quality, and sector composition.
Essentially, we should “anchor to today’s multiples as the new normal rather than expecting mean reversion to a bygone era” as Bank of America head equity strategist Savita Subramanian would have us believe.
Thankfully, data can adjust for these different dynamics in efforts to obtain better comparables.
So, what do the charts tell us?
They still show stocks are expensive, although some suggest they aren’t THE bubble valuations as mainstream media has you believe.
I offer two examples.
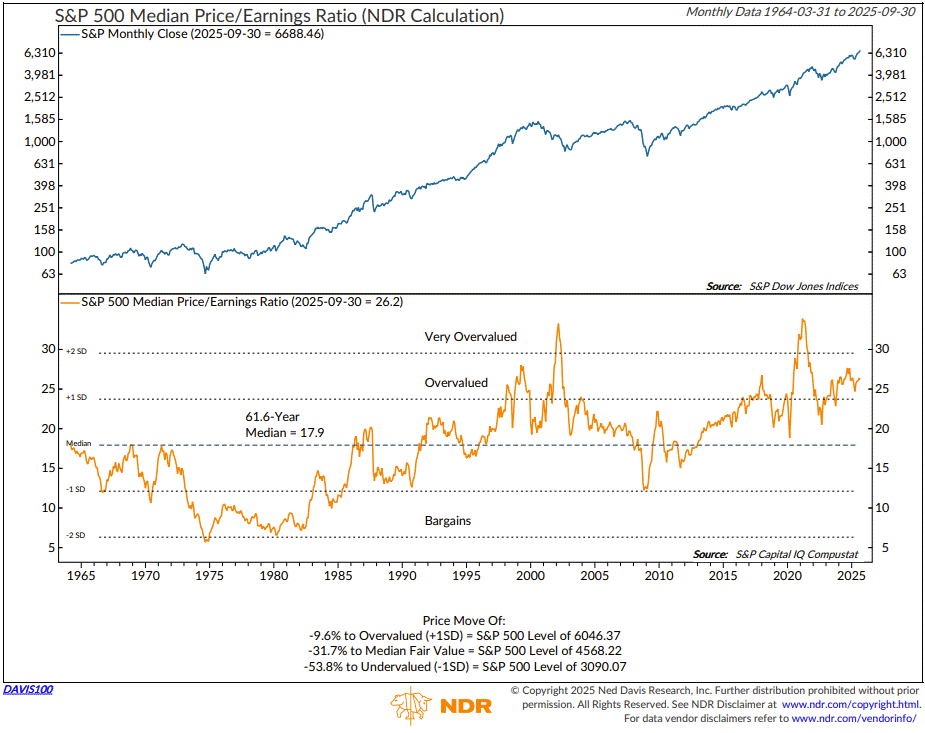
The median P/E gives us information about the “average” stock by avoiding being skewed by overvaluations in the few mega-caps. And yet, this still shows the average stock is expensive.
The S&P 500 median P/E of 26.2 is in the top 5% of readings since 1964 and only surpassed by the 1990s/2000s tech bubble, the post-pandemic period of irrational exuberance 2021, and a smattering of readings in the last 18 months.
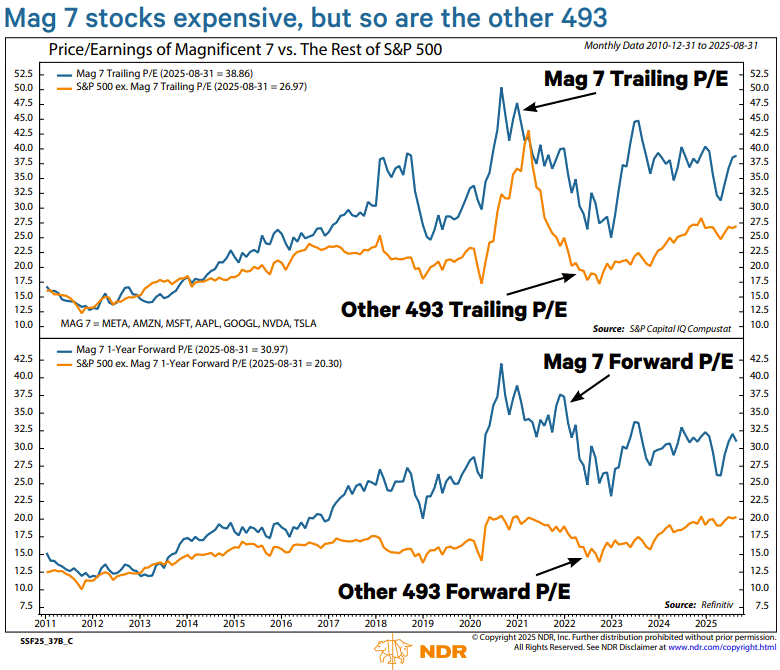
Another way to adjust historical analogs is account for the Mag 7, which have gotten a lot of the blame for the high index-level P/Es.
And yet, despite their huge outperformance in recent years, they are not the sole reason for high valuations.
The current Mag 7 trailing P/E of 38.9 is in the top 15% of readings since 2010, versus the top 10% for the S&P 493. For forward P/Es, the Mag 7 P/E of 31.0 is in the top 20% since 2010, versus 2% for the S&P 493.
Ok, so what does all this tell us?
We must remind ourselves that while valuations reveal risks, they are poor timing tools.
The day of reckoning will eventually come, most likely around the next recession when earnings normally fall sharply. But, that day is not today.
The clearest path to justifying current valuations is if earnings growth proves to be higher than expected, like much higher. Those fully invested are dependent upon the profit margin promises from A.I. coming to fruition.
Sources: YCharts, Bloomberg, Ned Davis Research
That’s all for today.
Blake
Questions about your financial goals or future?
Connect with a Sandbox financial advisor – our team is here to support you every step of the way!
Welcome to The Sandbox Daily, a daily curation of relevant research at the intersection of markets, economics, and lifestyle. We are committed to delivering high-quality and timely content to help investors make sense of capital markets.
Blake Millard is the Director of Investments at Sandbox Financial Partners, a Registered Investment Advisor. All opinions expressed here are solely his opinion and do not express or reflect the opinion of Sandbox Financial Partners. This Substack channel is for informational purposes only and should not be construed as investment advice. The information and opinions provided within should not be taken as specific advice on the merits of any investment decision by the reader. Investors should conduct their own due diligence regarding the prospects of any security discussed herein based on such investors’ own review of publicly available information. Clients of Sandbox Financial Partners may maintain positions in the markets, indexes, corporations, and/or securities discussed within The Sandbox Daily. Any projections, market outlooks, or estimates stated here are forward looking statements and are inherently unreliable; they are based upon certain assumptions and should not be construed to be indicative of the actual events that will occur.
Please see additional disclosures (click here)
Please see our SEC Registered firm brochure (click here)
Please see our SEC Registered Form CRS (click here)