

Car prices crash, plus volatile Chinese stocks and S&P 500 returns across different time horizons
The Sandbox Daily (11.7.2022)

Welcome, Sandbox friends.
Today’s Daily discusses the continued slide in used car prices, heightened volatility in Chinese stocks, the S&P 500 longer-term moving averages, sector divergences, and a tough day for the U.S. dollar.
Let’s dig in.
Markets in review
EQUITIES: Dow +1.31% | Nasdaq 100 +1.11% | S&P 500 +0.96% | Russell 2000 +0.55%
FIXED INCOME: Barclays Agg Bond -0.32% | High Yield -0.01% | 2yr UST 4.722% | 10yr UST 4.214%
COMMODITIES: Brent Crude -0.78% to $97.98/barrel. Gold -0.01% to $1,676.3/oz.
BITCOIN: -1.64% to $20,625
US DOLLAR INDEX: -0.49% to 110.239
CBOE EQUITY PUT/CALL RATIO: 0.74
VIX: -0.81% to 24.35
Used car prices slide further
Used car prices continue to crash per Cox Automotive’s Manheim Used Vehicle Value Index, which tracks prices of used vehicles sold at its U.S. wholesale auctions.
Wholesale used vehicle prices decreased -2.2% in October from September. While the current market is still much elevated versus historical measures, the meteoric rise in used car prices that we witnessed in 2021 has clearly reversed as the air has come out of this particular bubble. This is welcome news – the market is normalizing after a period of unique supply/demand imbalances and real people across America are finding more attractive prices.
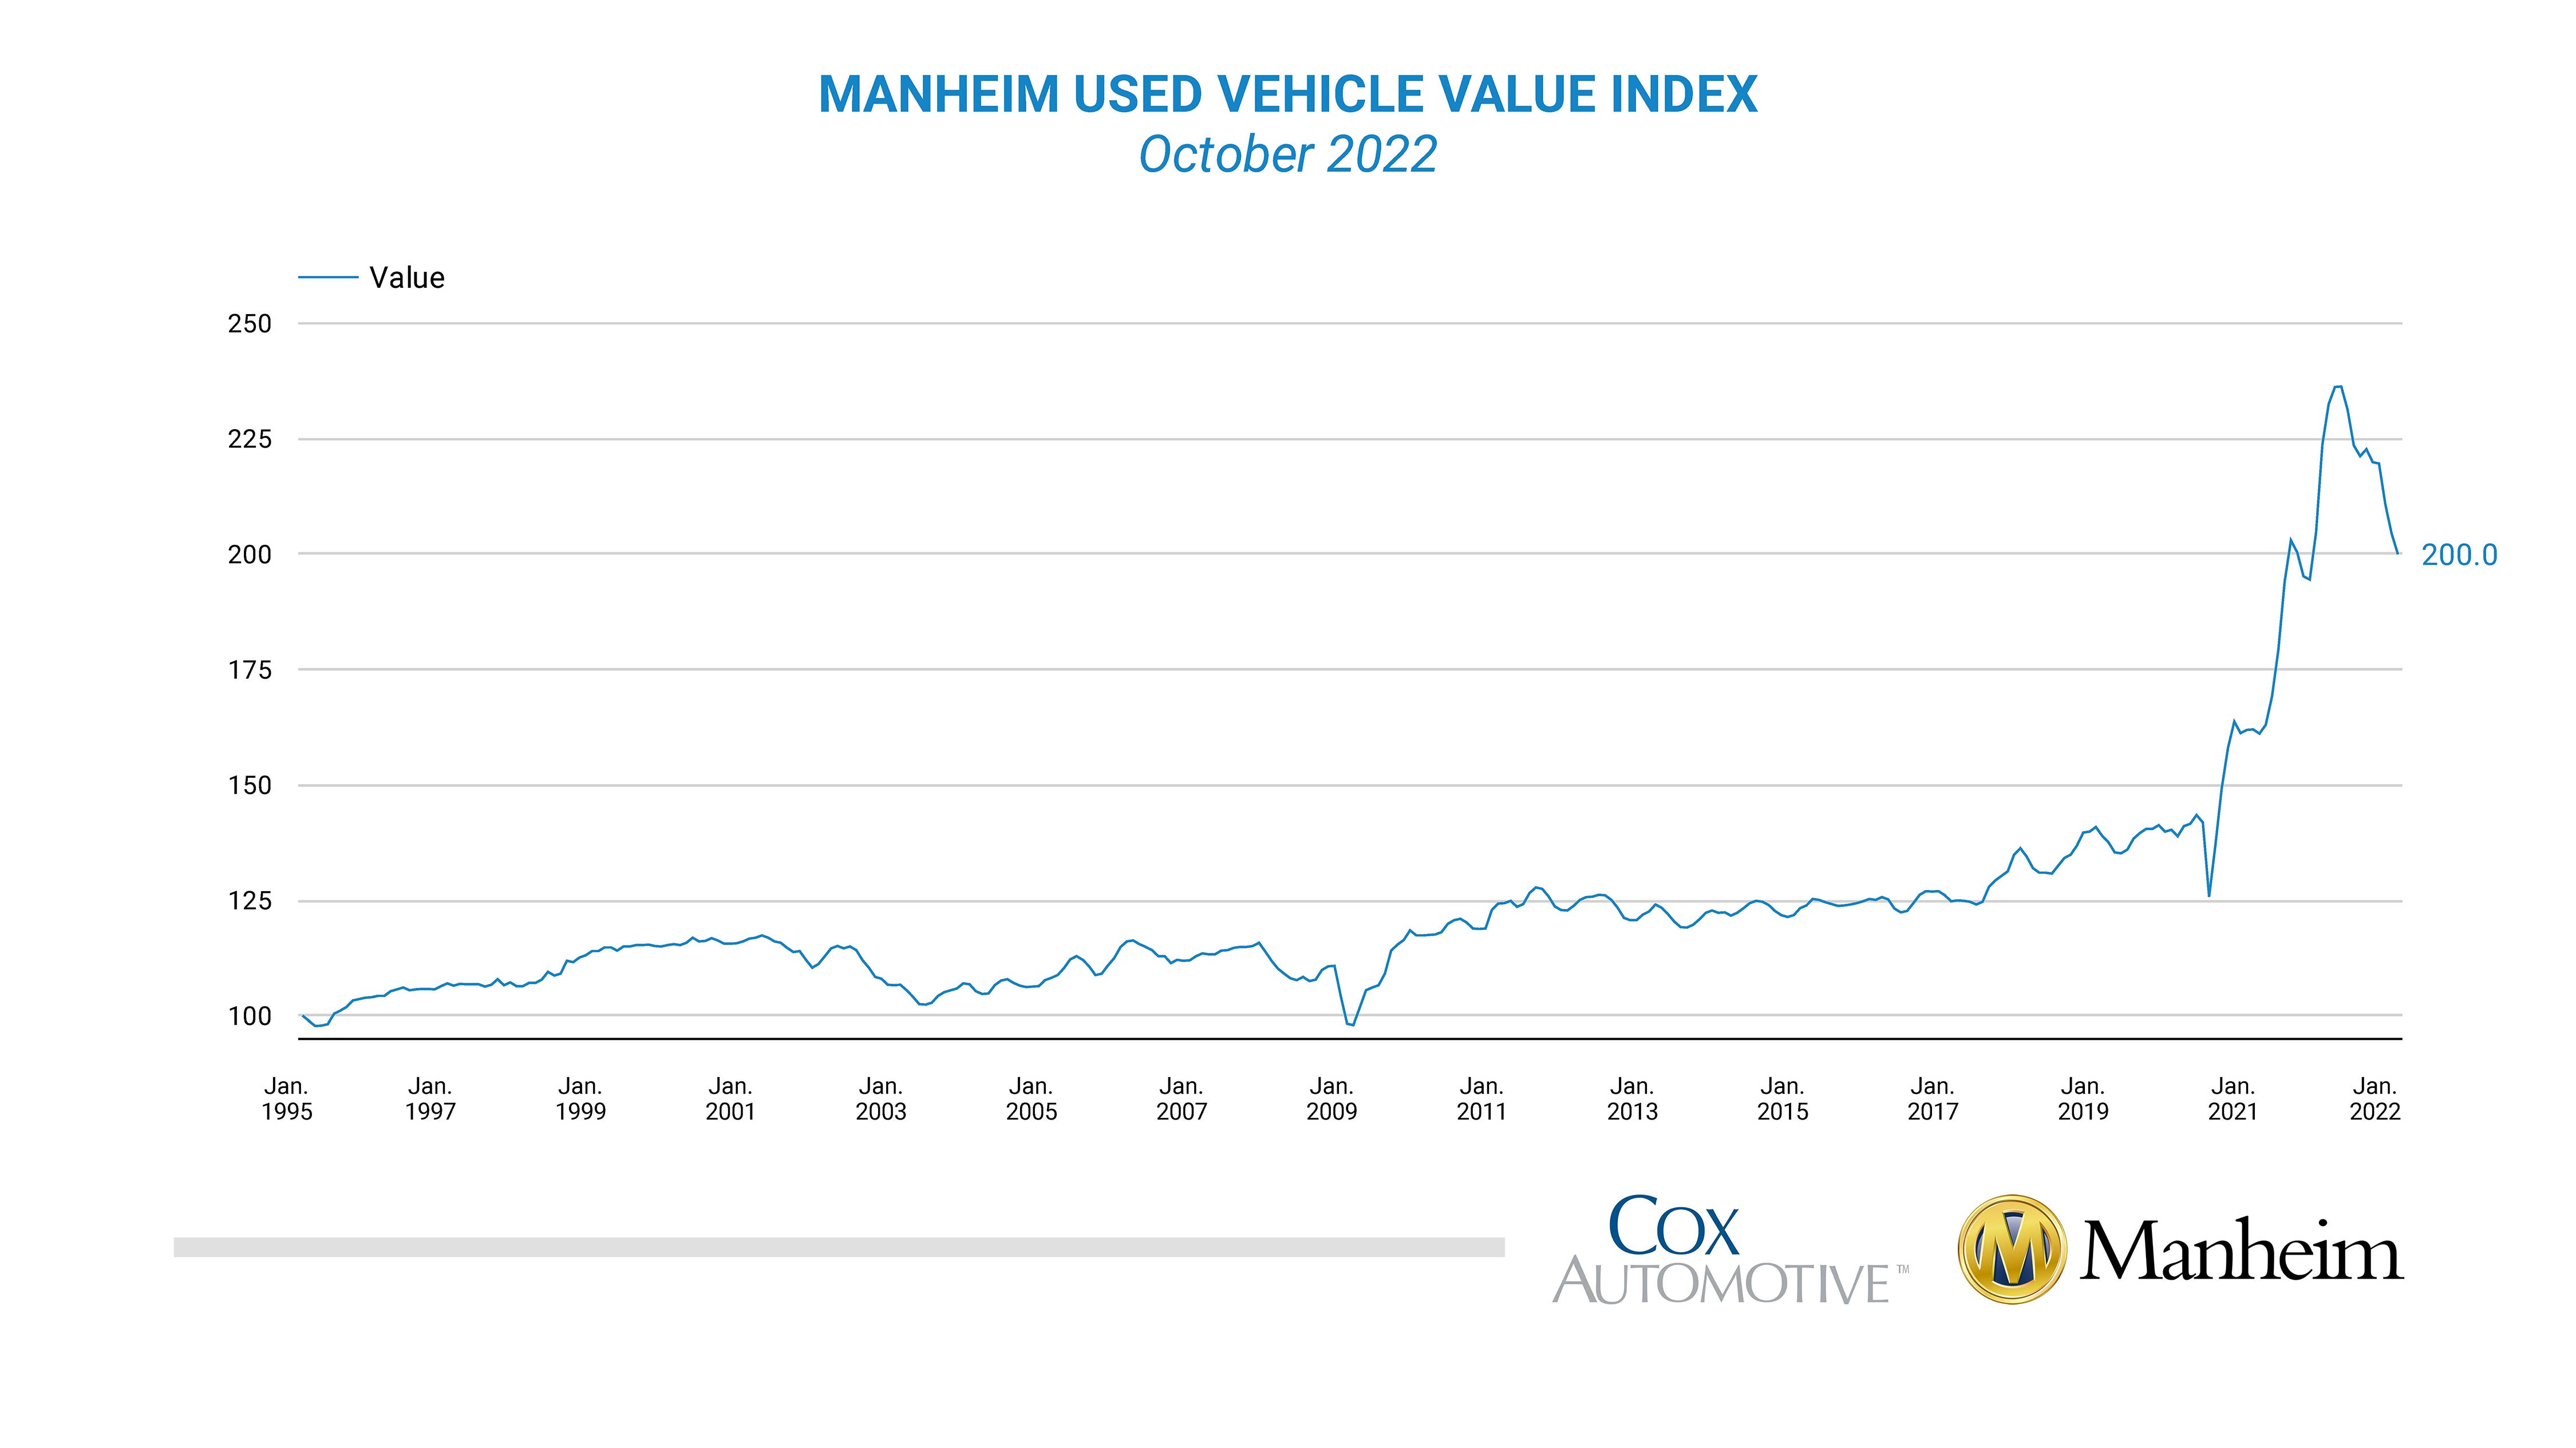
The year-on-year change came in at -10.4% in October, its worst reading since December 2008. These price drops should begin to flatten out in the coming months, but for now, this report suggests the bucket of used cars and trucks in the Consumer Price Index (CPI) will be down again in October as it catches down to auction price data. As a reminder, we get fresh CPI data for October later this week on Thursday, November 10th at 8:30am which the market is eagerly awaiting.

On a related note, the online used car retailer, Carvana (CVNA), is making headlines again as the stock continues its spectacular collapse. This pandemic darling was a beneficiary of zero interest rates and the sugar-high valuation excesses of 2021. The unwind is remarkable, down from a peak of $370 to $7 in just 15 months – or down ~98% since August 2021.

From a trading perspective, one should always exercise caution when bottom feeding after a major selling program hits a stock – this knife might not be done falling yet.
Year-to-date to Thursday, November 7th – the day that Carvana reported dismal 3rd earnings and guidance – the stock was already down -93.8%. Since earnings just last Thursday, it has been nearly cut in half!

Ouch!
Source: Manheim, Liz Ann Sonders, Calculated Risk, CNBC, All Star Charts, Sandbox Financial Partners
Bullish engulfing pattern?
Extreme volatility in both directions is common at turning points.
Two weeks ago, the Hang Seng Index – a market-cap weighted index of the largest companies of the Hong Kong stock market – registered its worst week in nearly 5 years.
Last week, it engulfed that action with its best weekly performance in over 10 years – meaning it opened lower than the prior week and took out the lows (not good) before reversing and closing above the prior week for a gain (perceived to be good).
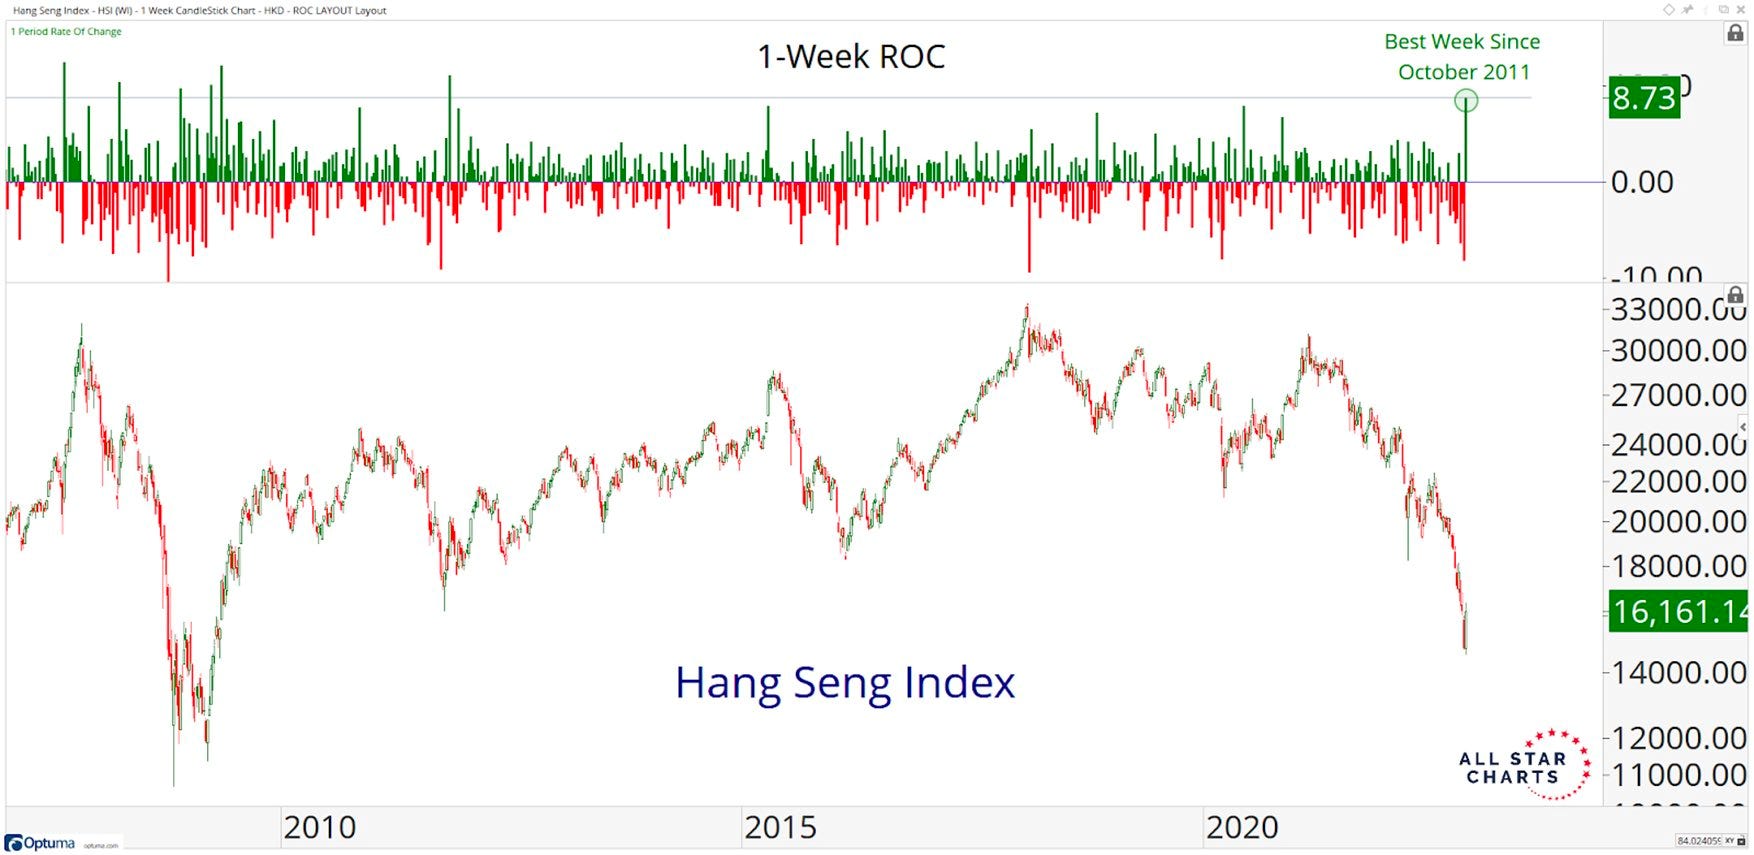
Are Chinese equities forming a bottom?
Source: Steve Strazza, The Chart Report
Widening the aperture
From a long-term trend perspective, a prospective crossing over of the 50-week moving average (approximately one year’s price action) and 100-week moving average (two years) would demarcate this from a shakeout/correction to a proper shift in trend – a concept which would be outright foreign to most.
Stocks needs to stage a strong rally in order for these long-term moving averages to hold. A lot of price pain took place the last two times these moving averages crossed over – the Dot Com Bubble and Great Financial Crisis.

Source: Howard Lindzon
Sector divergences remain in place
Since the October 12th low on the S&P 500, two sectors have already made new lows – Communication Services and Consumer Discretionary – while leadership firmly remains in the energy sector.

Source: Sandbox Financial Partners
Volatile week for the dollar
The dollar fell -1.9% on Friday, its worst single day showing since 2015. It still ended the week slightly higher, but a move of that magnitude is interesting. It prevented the daily Moving average convergence/divergence indicator (MACD) from flipping to a buy and the resolution of that triangle is very important to watch. Higher and equities likely won’t do well, but a breakdown would almost certainly be bullish.

Source: Beat the Bench
That’s all for today.
Blake
Welcome to The Sandbox Daily, a daily curation of relevant research at the intersection of markets, economics, and lifestyle. We are committed to delivering high-quality and timely content to help investors make sense of capital markets.
Blake Millard is the Director of Investments at Sandbox Financial Partners, a Registered Investment Advisor. All opinions expressed here are solely his opinion and do not express or reflect the opinion of Sandbox Financial Partners. This Substack channel is for informational purposes only and should not be construed as investment advice. Clients of Sandbox Financial Partners may maintain positions in the markets, indexes, corporations, and/or securities discussed within The Sandbox Daily.
Good insights. Thanks!