

Corporate defaults, plus household savings, 2024 market expectations from Presidential cycles, and used car prices
The Sandbox Daily (12.7.2023)

Welcome, Sandbox friends.
Today’s Daily discusses:
corporations transition to higher cost of funding environment
steady erosion of household excess savings, liquidity
politics of 2024
used car prices illustrative of more disinflation
Let’s dig in.
Markets in review
EQUITIES: Nasdaq 100 +1.48% | Russell 2000 +0.87% | S&P 500 +0.80% | Dow +0.17%
FIXED INCOME: Barclays Agg Bond +0.03% | High Yield +0.17% | 2yr UST 4.592% | 10yr UST 4.148%
COMMODITIES: Brent Crude +0.19% to $74.44/barrel. Gold -0.13% to $2,045.3/oz.
BITCOIN: -1.26% to $43,309
US DOLLAR INDEX: -0.49% to 103.638
CBOE EQUITY PUT/CALL RATIO: 0.59
VIX: +0.69% to 13.06
Quote of the day
“Crashes are the short-term price we pay for the long-term rewards of investing in stocks. As I've often written, only those investors with both cash and courage can take advantage of a crash. It pays to keep plenty of both. You never know when you'll get to use them.”
- Jason Zweig
Publisher’s note
I will be away traveling on Friday so the next Sandbox Daily will arrive in your inbox on Monday, December 11th.
Also of note, next week we will be focusing on wrapping a bow around 2023 and covering year-end themes!
Corporations transition to higher cost of funding environment
While the pace of corporate defaults has notably accelerated in recent quarters, default rates are still hovering around their long-run average.
The corporate default rate that had stayed suppressed during the rock-bottom years of 2021 and 2022 is past the trough and is beginning to rise back to its long-run average due to the increasing pressure from elevated funding costs and slowing economic growth.
The 12-month trailing U.S. high yield default rate has risen from 1.4% a year ago to 3.6% today. For leveraged loans the uptick in defaults has been even starker, moving from 1.7% a year ago to 5.2% today.
BUT, keep in mind the current default cycle is still well below the peaks of previous cycles.
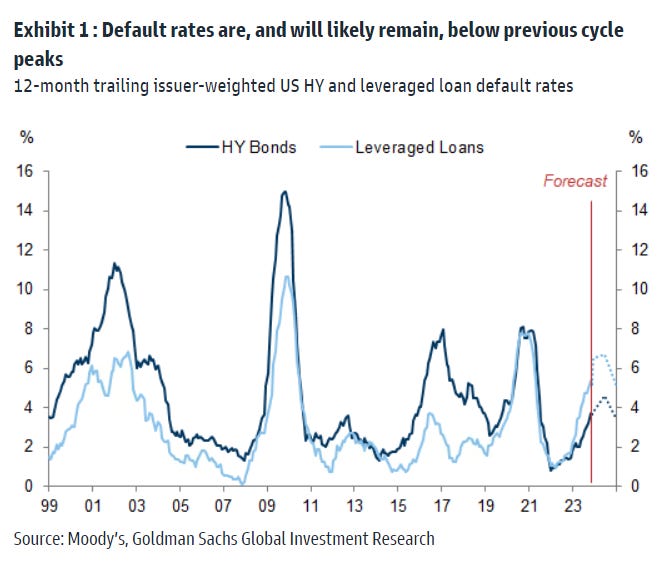
Three key takeaways to highlight:
Defaults have risen but not spiked, where the worst of it should peak around mid-to-late 2024/early 2025
The composition of defaults has been skewed toward smaller firms with little notional outstanding
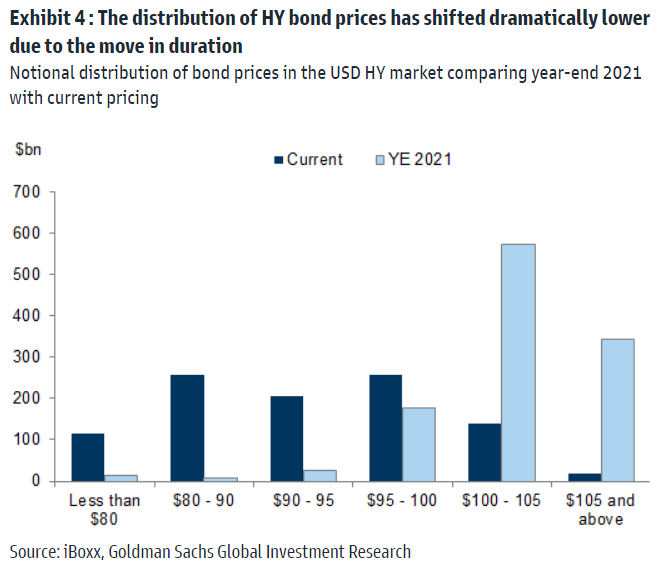
Losses have been more benign than usual because the exogenous shock from all rates simultaneously lifting higher shifted the entire distribution of corporate bond prices downward. Meaning, since we have a lower starting point for bond prices, losses (given a default) have been somewhat better than past cycles. See chart below.
Source: Goldman Sachs Global Investment Research
Steady erosion of household excess savings, liquidity
Excess U.S. household liquidity – i.e. cash and cash-equivalent assets – has fallen from a peak of $3.4 trillion to $1.0 trillion and should largely be exhausted by the 2nd quarter of 2024, based on estimates from J.P. Morgan.
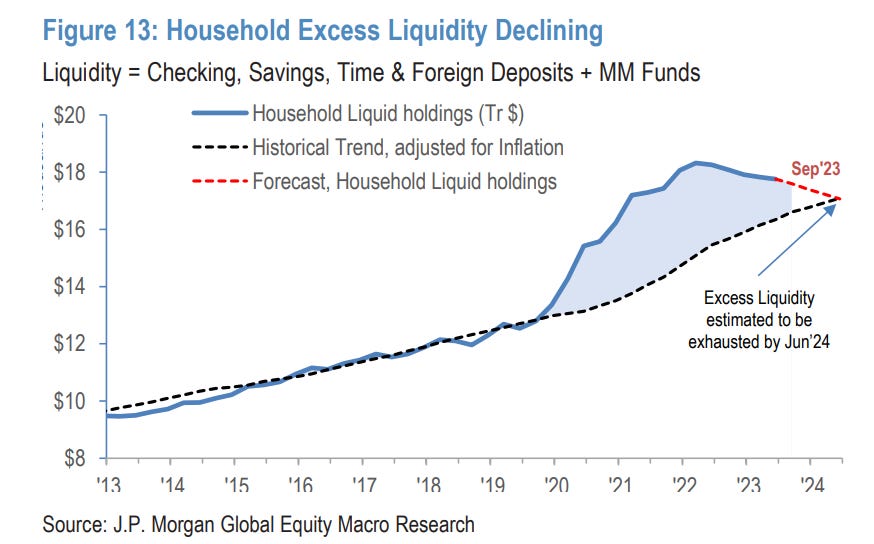
Importantly, nearly all the inflation-adjusted excess cash sits with the relatively affluent (top 20%), while the middle class (top 20%-60%) real liquidity is back to pre-Covid levels.
The bottom 40%, well… are worse off. The lower quintiles of household income and net worth are always disproportionately affected by inflation spikes.
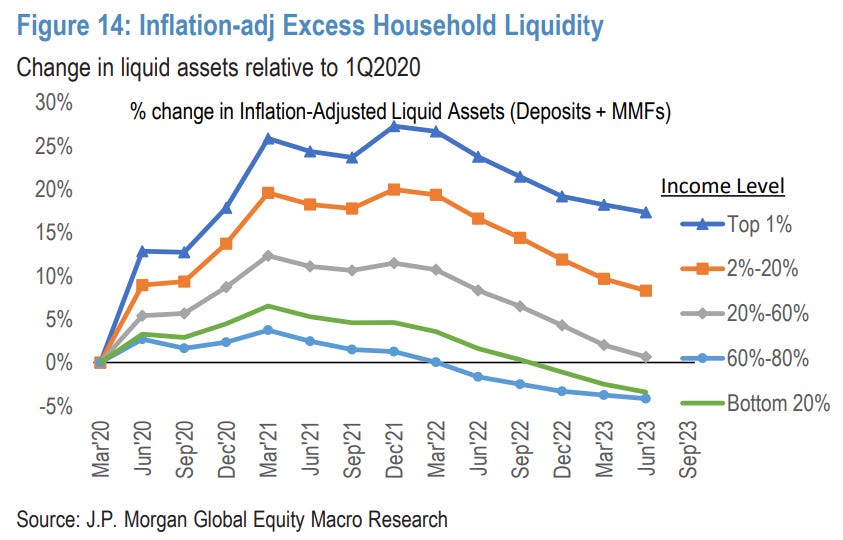
One argument the bears lean on is the massive fiscal transfer and monetary injection that have supported households and businesses since 2020 are a diminishing counterbalance against rising real interest rate, declining household liquidity, and tightening financial conditions
Source: J.P. Morgan Markets
Politics of 2024
334 days remain until the 2024 United States presidential election takes place.
Absent a major changes to the current primary dynamics, it’s looking increasingly likely that incumbent President Joe Biden and former President Donald Trump will face each other in a rematch next November.
For now, we look to history as a guide for what to expect during the 4th year under both a Democrat president residing at 1600 and all Presidents in the Oval Office.
The 4th year of 1st-term Democratic presidents see an average stock market gain of +12.9% (sample size=8), while the 4th year of any parties’ 1st-term president enjoys an average gain of +13.0% (sample size=20).
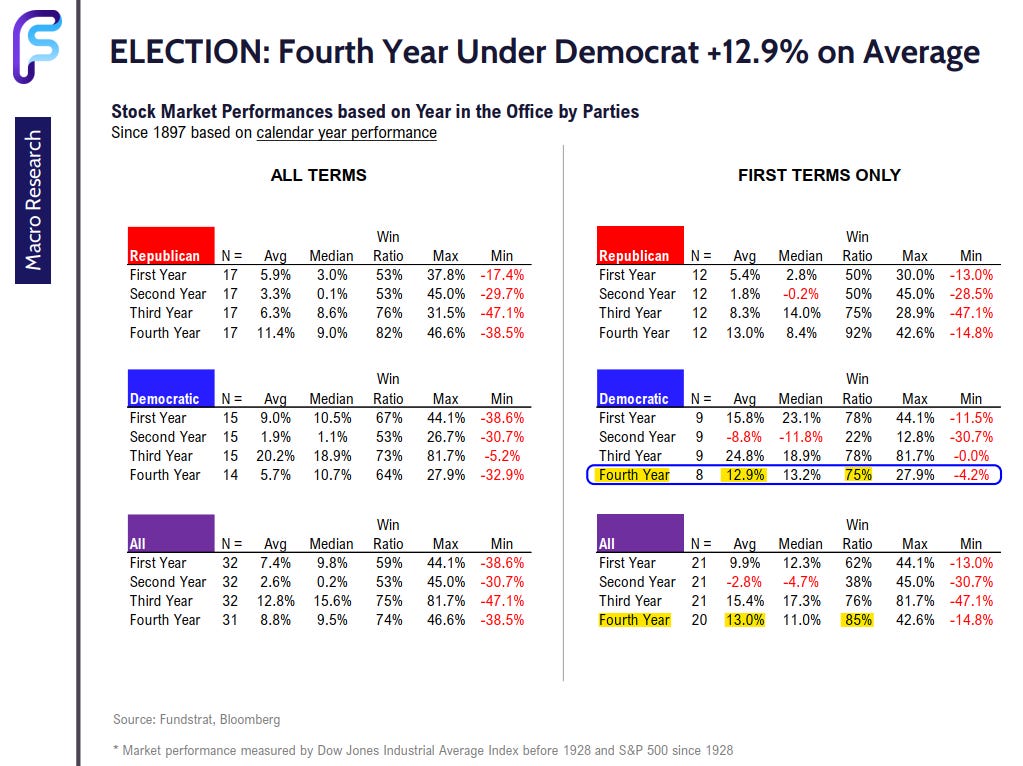
Source: FS Insight
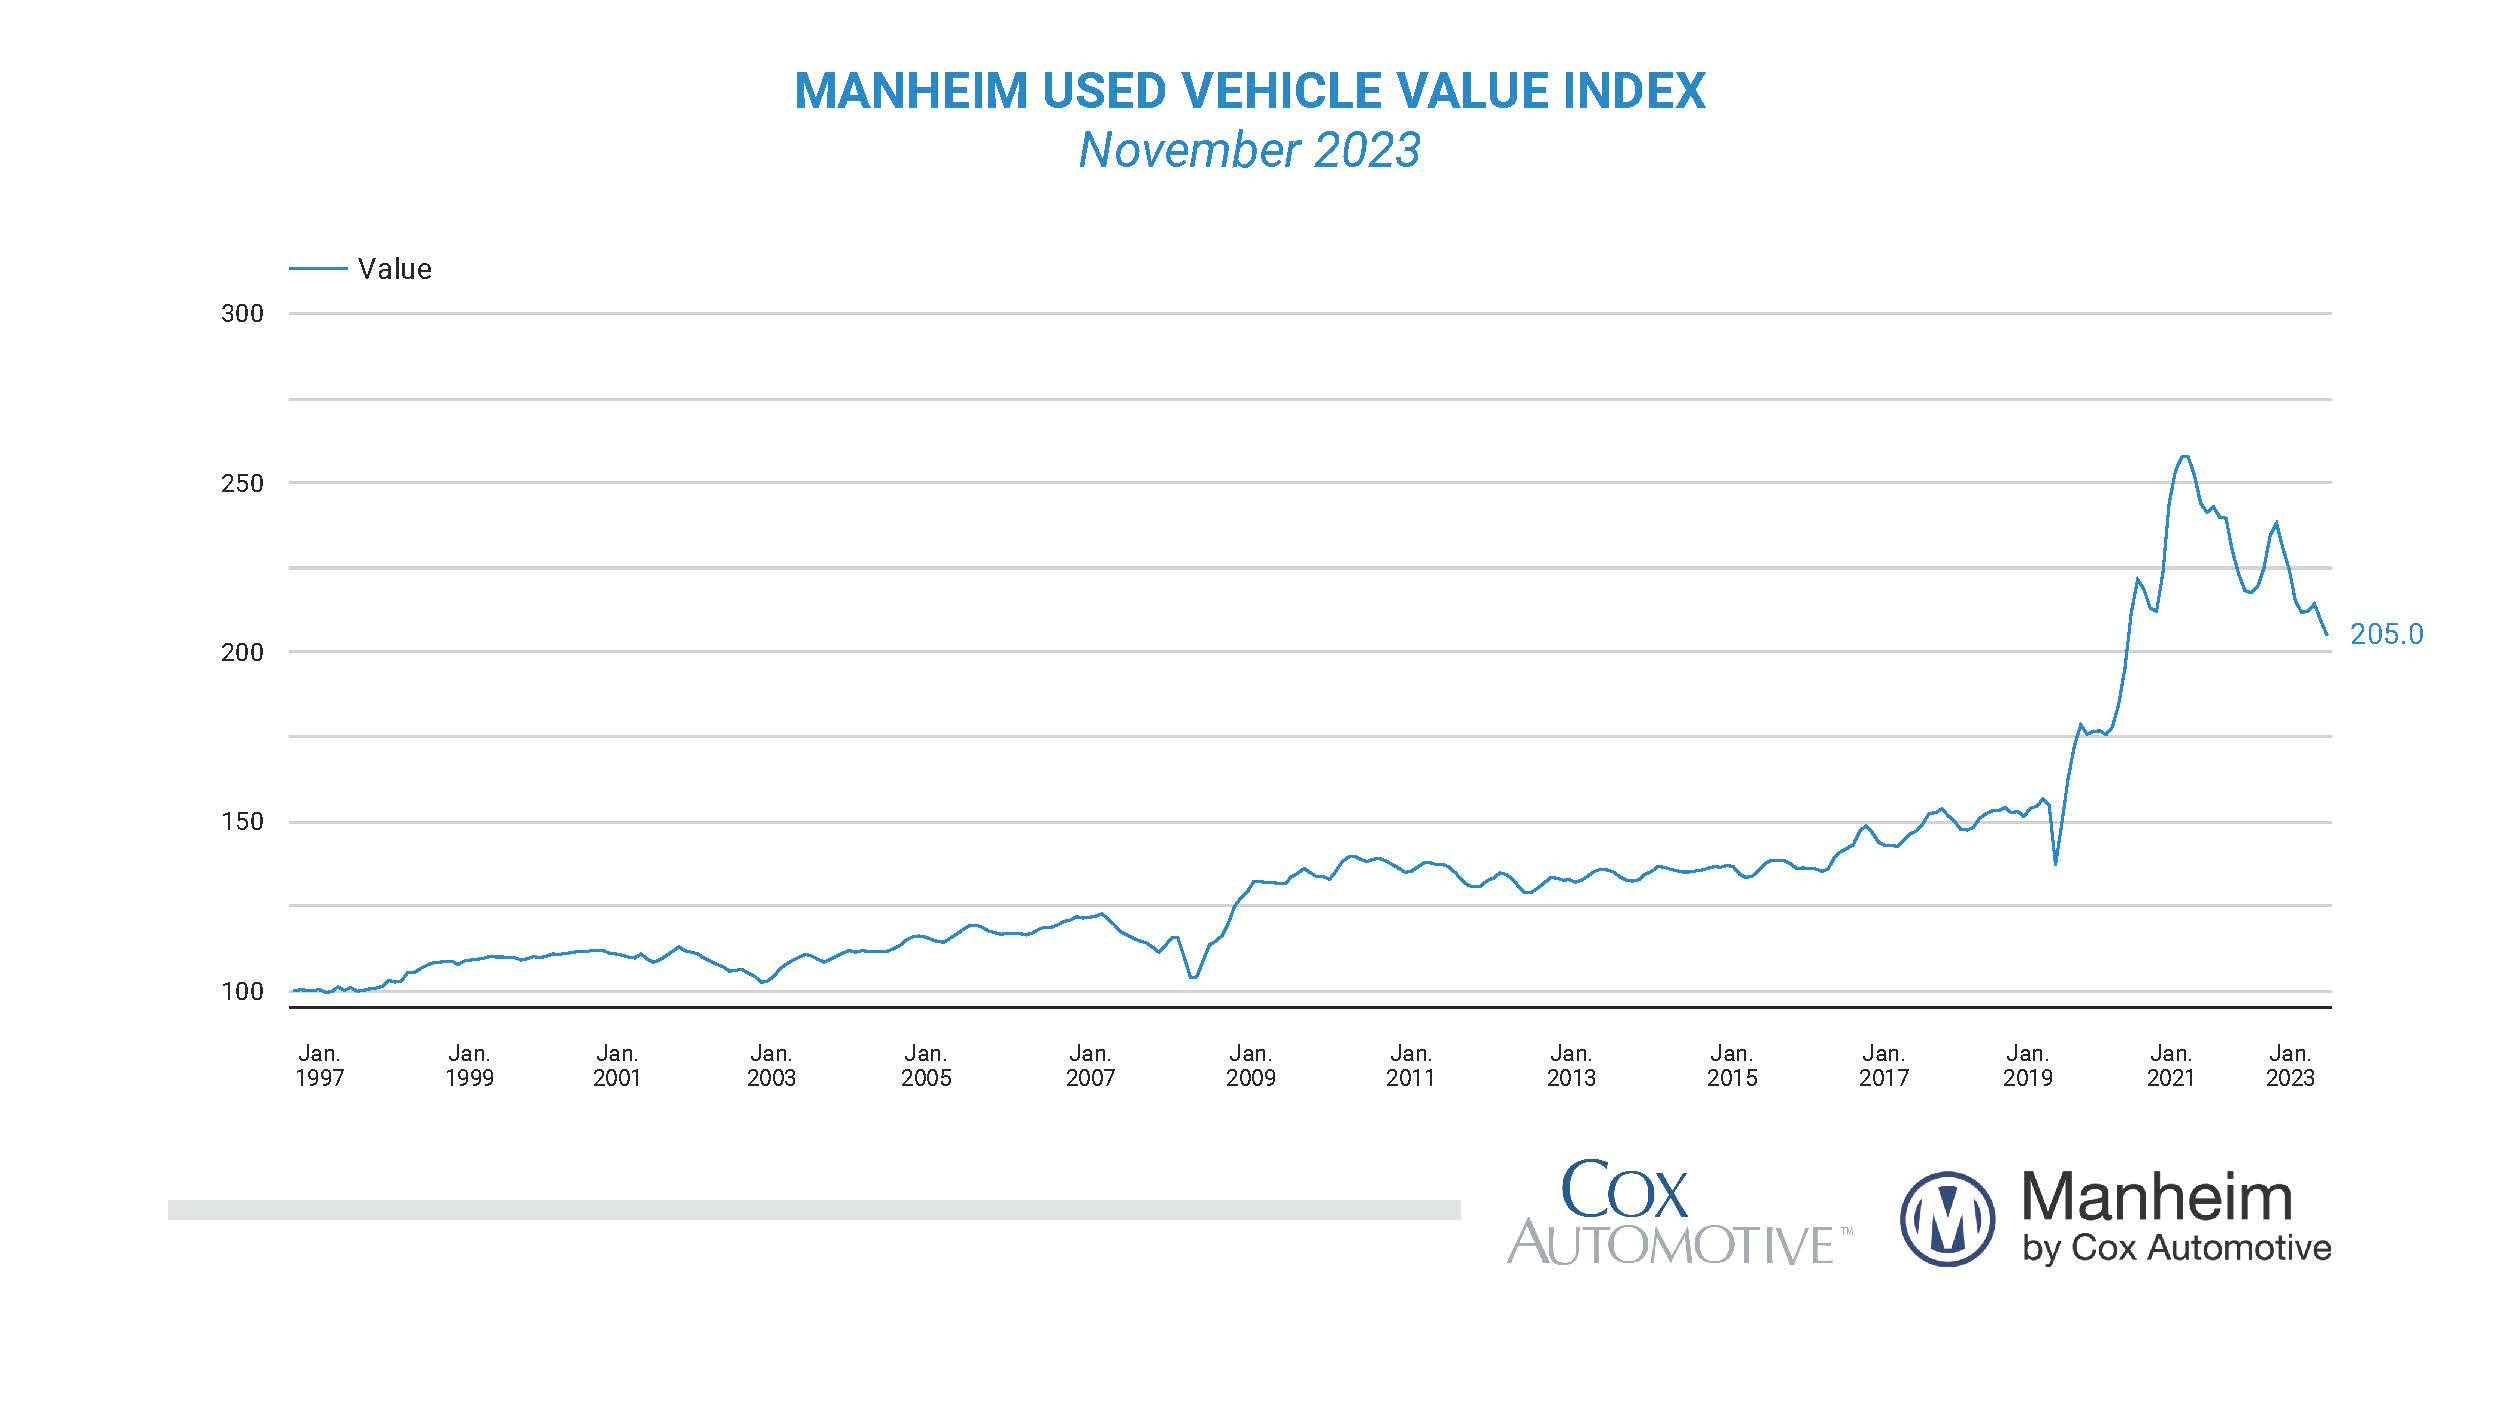
Used car prices illustrative of more disinflation
The Manheim Used Vehicle Value Index fell -2.1% MoM in November, down for the 2nd consecutive month and down 6 of the past 8 months.
It has declined -5.8% from a year ago, with prices falling across all major market segments. Compact cars remained the worst YoY performer, while pickups and SUVs fell less than the industry as a whole.
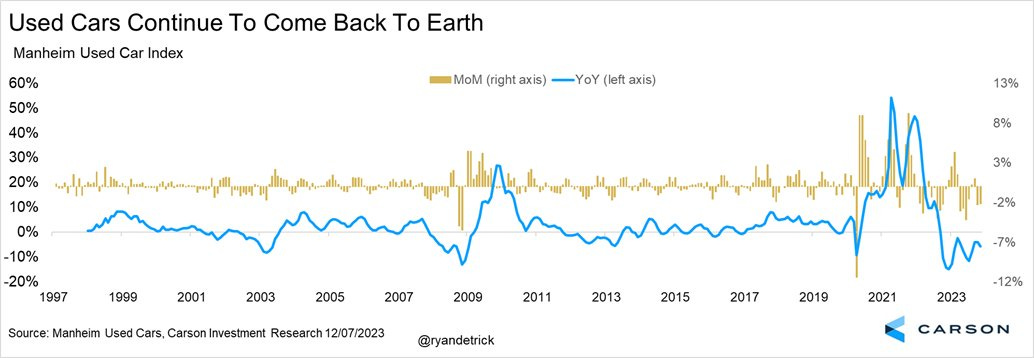
Following a spike during the pandemic, the index now sits at its lowest level since March 2021.
This is an illustration of disinflation.
If the Manheim index is to mean-revert back to its long-term trend, then there’s plenty more room for car prices to fall:
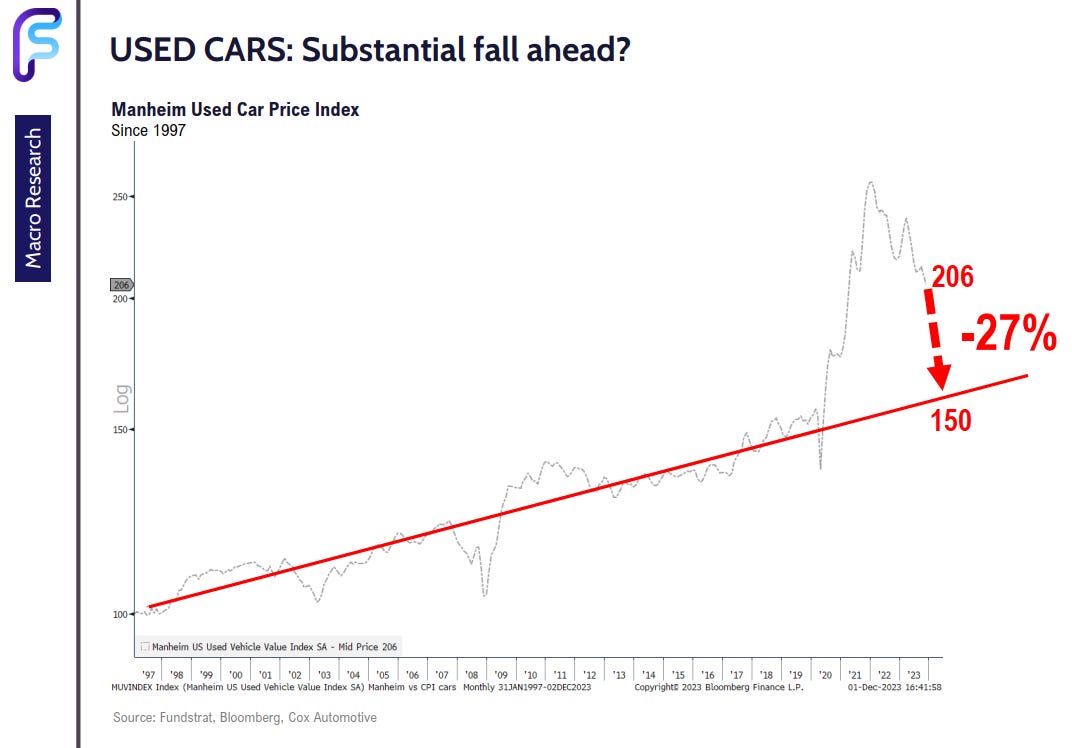
The steady drop in the Manheim Index suggests continued decline in the CPI for used cars and trucks in the coming months, as well as feeding into more downside core CPI readings. In fact, wholesale Manheim is about 2 months ahead of core CPI.
We get an update from the Bureau of Labor Statistics on inflation next week.
Source: Cox Automotive, Ned Davis Research, Ryan Detrick, FS Insight
That’s all for today.
Blake
Welcome to The Sandbox Daily, a daily curation of relevant research at the intersection of markets, economics, and lifestyle. We are committed to delivering high-quality and timely content to help investors make sense of capital markets.
Blake Millard is the Director of Investments at Sandbox Financial Partners, a Registered Investment Advisor. All opinions expressed here are solely his opinion and do not express or reflect the opinion of Sandbox Financial Partners. This Substack channel is for informational purposes only and should not be construed as investment advice. The information and opinions provided within should not be taken as specific advice on the merits of any investment decision by the reader. Investors should conduct their own due diligence regarding the prospects of any security discussed herein based on such investors’ own review of publicly available information. Clients of Sandbox Financial Partners may maintain positions in the markets, indexes, corporations, and/or securities discussed within The Sandbox Daily. Any projections, market outlooks, or estimates stated here are forward looking statements and are inherently unreliable; they are based upon certain assumptions and should not be construed to be indicative of the actual events that will occur.