Credit cards showing fatigue, plus SPX forward P/E, Nasdaq, labor market, and Industrials
The Sandbox Daily (3.6.2023)
Welcome, Sandbox friends.
Today’s Daily discusses:
credit card debt showing early signs of consumer fatigue
what investors are willing to pay for next year’s earnings
Nasdaq buyers step in
labor market by the numbers
Industrials close in on 52-week highs
Let’s dig in.
Markets in review
EQUITIES: Dow +0.12% | Nasdaq 100 +0.10% | S&P 500 +0.07% | Russell 2000 -1.48%
FIXED INCOME: Barclays Agg Bond -0.25% | High Yield 0.00% | 2yr UST 4.886% | 10yr UST 3.964%
COMMODITIES: Brent Crude +0.50% to $86.26/barrel. Gold -0.12% to $1,852.4/oz.
BITCOIN: -0.15% to $22,428
US DOLLAR INDEX: -0.22% to 104.290
CBOE EQUITY PUT/CALL RATIO: 0.59
VIX: +0.65% to 18.61
Quote of the day
“The stock market transfers money from the active to the patient. Successful investing takes time, discipline, and patience.”
-Warren Buffett
Credit card debt showing early signs of consumer fatigue?
Time and time again, whether it’s the C-suite executives in the recent earnings cycle or the money center banks or selective sell side strategists, we keep hearing about the strength and resiliency of the consumer. But inflation has taken the bite out of the wallets of everyone in the United States, with savings rates down and credit card usage up.
As of the 4th quarter of 2022, total household debt rose by $394 billion, or 2.4%, to $16.9 trillion in the fourth quarter of 2022, according to the New York Fed’s Quarterly Report on Household Debt and Credit.
Balances are up in every category, but focusing specifically on credit card balances, those were up by $61 billion in the 4th quarter to $986 billion, when the previous high was $927 billion in pre-pandemic times.
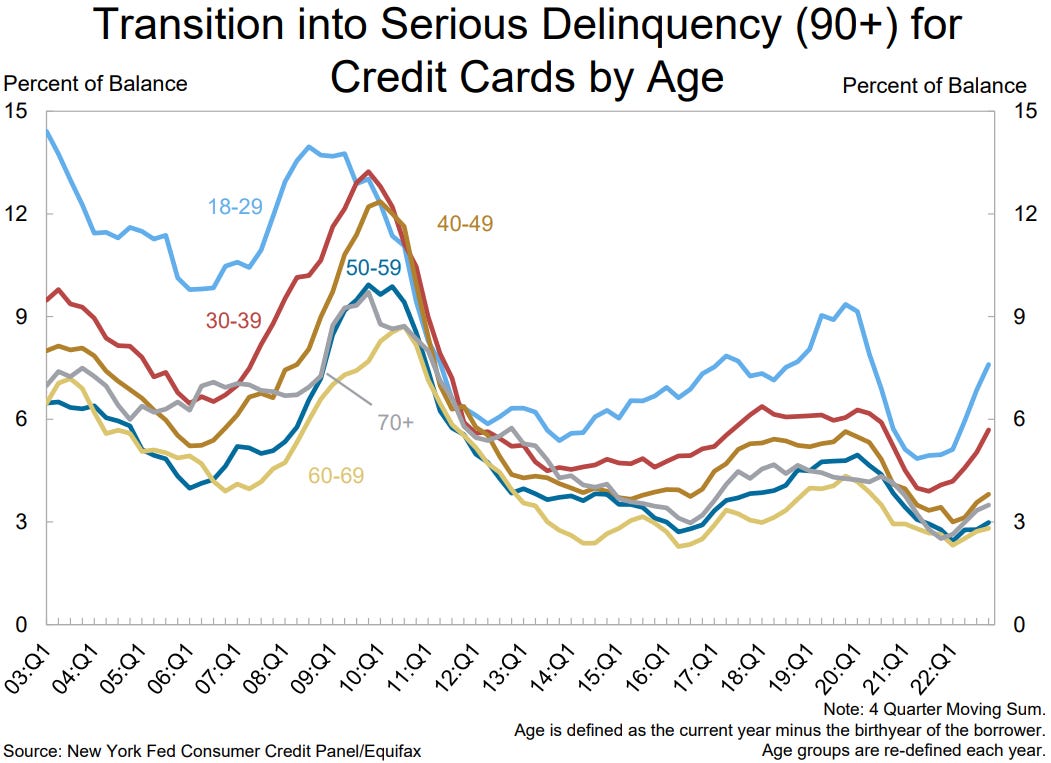
The numbers that start grabbing the market’s attention pertain to delinquencies, in which the share of current debt transitioning into delinquency increased for nearly all debt types. Here’s a look at both debt transitioning into 30+ days of delinquency and 90+ days; the plunge in student loans was only due to the federal policy to cease repayments and bucks the trends shown in other categories.
Splitting credit card delinquencies by age shows some diffusion among borrowers, in which younger borrowers are clearly struggling with credit card payments. This is to be expected as inflation disproportionately effects lower income earners, which often coincides with the younger cohorts of the working population.
How the consumer continues to weather the storm should be instrumental in the Fed’s thinking in terms of policy decisions over the coming weeks and months.
Source: Federal Reserve Bank of New York, Federal Reserve Bank of St. Louis
What investors are willing to pay
Everyone on television keeps saying the market is too expensive.
The forward P/E ratio for the S&P 500 is 16.1x. For context, the 25-year average is 16.8x, so the market is not extended at least versus recent history.
Perhaps another way to refute this claim is the distortion created by the higher multiples of FAANG. The S&P 500 ex-FAANG is 14.8x, also a relatively inexpensive multiple.
Source: FS Insight
Nasdaq buyers step in
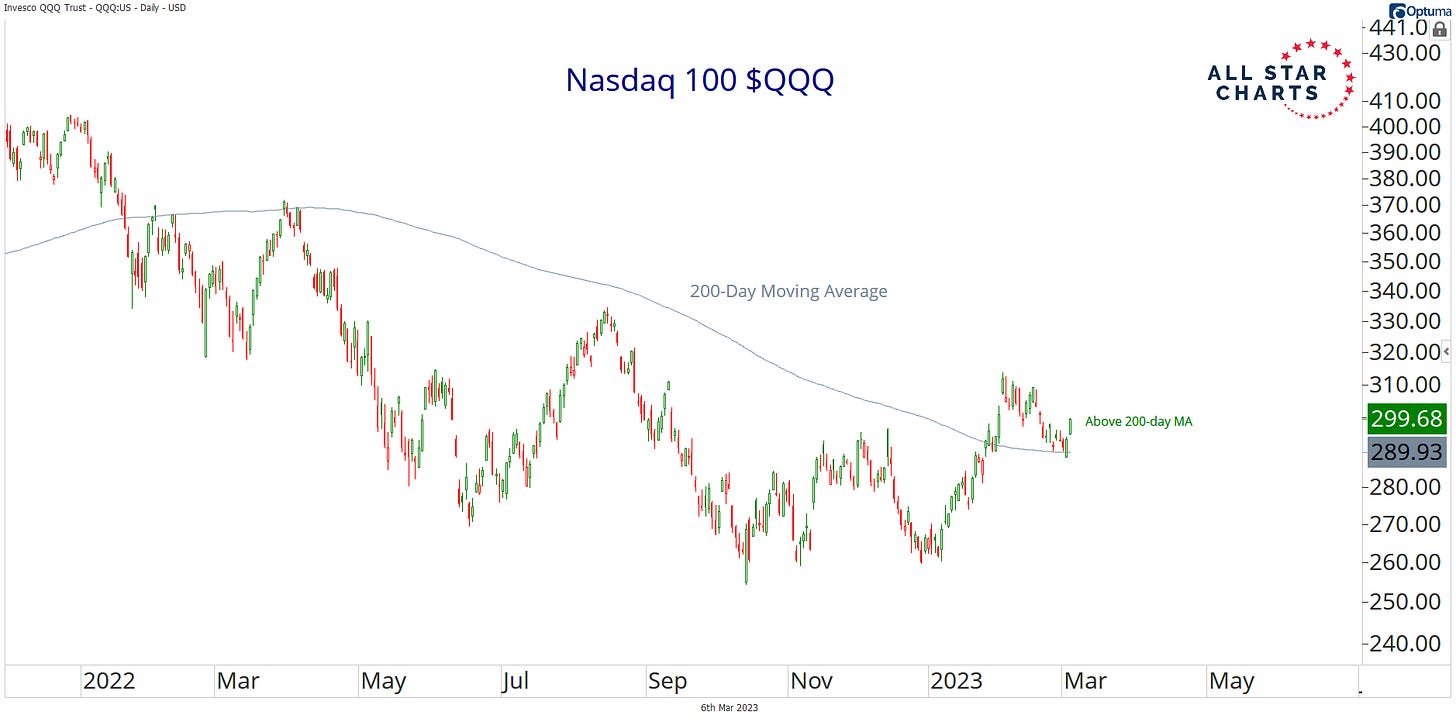
The Nasdaq 100 (QQQ) and other large-cap major averages just closed higher for their 3rd consecutive session. However, it's not today’s action that has the market’s attention, but the end of last week.
Last Thursday, Nasdaq bulls stepped in exactly where they needed to, defending the pivot highs from last fall and rebounding off the long-term moving average (MA).
It's been over a year since the S&P 500 and Nasdaq have spent this much time above their 200-day moving averages. While many should often avoid using a moving average as support or resistance due to the inherent lack of price memory, in this case, it provided just that.
As trend followers, moving averages can be used as trend identification tools. When price is above an upward-sloping 200-day MA, it tells us the trend is pointing higher. When it is below a downward-sloping 200-day MA, it tells us we’re in a downtrend. For now, we’re sitting on a flat 200-day MA, indicating the trend could still be sideways.
Source: All Star Charts
Labor market by the numbers
Today’s labor market is very tight. The unwavering resiliency of the U.S. labor market is one of – if not the – greatest source of tension in today’s economy.
We know the Fed is trying to bring some slack. Here is Federal Reserve Chairman Jerome Powell in response to the blowout jobs report from January in which the U.S. economy added 517,000 jobs: “We didn’t expect it to be this strong. It kind of shows you why we think that this [tightening cycle] will be a process that takes a significant period of time.”
Since February 2020 – roughly the beginning of the post-pandemic period – 2.7mm additional jobs have been added to the economy, while the unemployment rate is at a 53-year low of 3.4% and 11,012,000 jobs remain open for willing workers. Service-led industries have witnessed the highest shares of job growth since 2020 (professional and business services include legal, accounting, engineering, etc.), while government and Leisure and Hospitality remain firmly under pre-pandemic levels.
Wage growth has been struggling to keep pace with inflation and continues to show further signs of slowing, falling to +4.4% YoY which is down from a multi-decade high of +5.9% in March 2022. The Fed typically target annual wage growth of ~3.5%.
This week brings a fresh batch of new labor data for the market to interpret, with ADP private payrolls and JOLTS on Wednesday and the Bureau of Labor Statistics February non-farm payrolls report on Friday.
Source: Bureau of Labor Statistics, Visual Capitalist
Industrials close in on 52-week highs
It may sound hard to believe, especially with data from the manufacturing sector being the weakest of all the economic data, but the Industrials sector is currently less than 2% from an all-time high and is closer to a one-year high than any other sector.
While last Spring's high was just a 52-week high, the sector's record high from early January of last year is only a little more than 4% above current levels.
On a relative strength basis over the last five years, the Industrials sector has basically experienced three distinct phases. While the sector steadily underperformed the S&P 500 from early 2017 right up through COVID, it started its bottoming-out process in March 2020 through late 2021. Ever since the start of 2022, however, the sector has been steadily outperforming the S&P 500 and has seen the pace of that outperformance accelerate since the fourth quarter of 2022. Following this recent run, the sector has now erased all of its underperformance since early 2020.
Source: Bespoke Investment Group
That’s all for today.
Blake
Welcome to The Sandbox Daily, a daily curation of relevant research at the intersection of markets, economics, and lifestyle. We are committed to delivering high-quality and timely content to help investors make sense of capital markets.
Blake Millard is the Director of Investments at Sandbox Financial Partners, a Registered Investment Advisor. All opinions expressed here are solely his opinion and do not express or reflect the opinion of Sandbox Financial Partners. This Substack channel is for informational purposes only and should not be construed as investment advice. Clients of Sandbox Financial Partners may maintain positions in the markets, indexes, corporations, and/or securities discussed within The Sandbox Daily.


