Credit risks, plus Bitcoin, capital markets, active management, and mom & dad to the rescue!
The Sandbox Daily (3.28.2023)
Welcome, Sandbox friends.
Today’s Daily discusses:
credit risks trump inflation concerns
Bitcoin reclaims important level
capital markets on ice
active management underwhelms, again
mom and dad to the rescue
Let’s dig in.
Markets in review
EQUITIES: Russell 2000 -0.06% | Dow -0.12% | S&P 500 -0.16% | Nasdaq 100 -0.49%
FIXED INCOME: Barclays Agg Bond -0.15% | High Yield -0.05% | 2yr UST 4.084% | 10yr UST 3.571%
COMMODITIES: Brent Crude +1.02% to $78.92/barrel. Gold +1.07% to $1,992.5/oz.
BITCOIN: +1.18% to $27,297
US DOLLAR INDEX: -0.43% to 102.419
CBOE EQUITY PUT/CALL RATIO: 0.67
VIX: -3.06% to 19.97
Quote of the day
“History provides a crucial insight regarding market crises: they are inevitable, painful and ultimately surmountable.”
-Shelby M.C. Davis
Credit risks trump inflation concerns
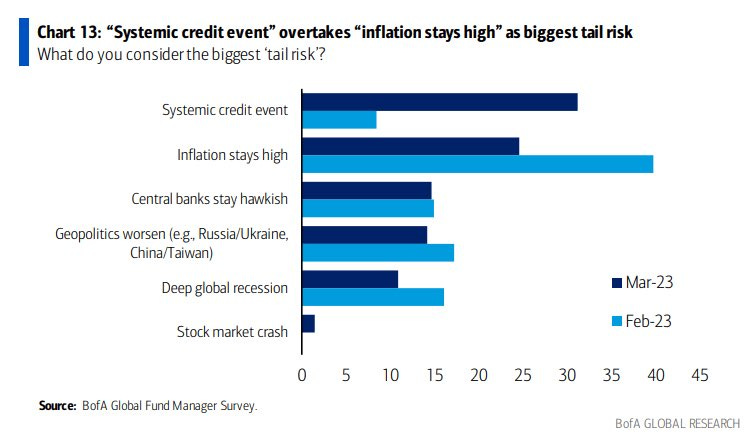
Courtesy of Bank of America’s March Global Fund Manager Survey, the results show that professional money managers are now more concerned with credit risk than lingering high inflation.
This survey points to the Fed's delicate balancing act between financial stability and inflation. If rates stay high, money will continue to leak from banks to money market funds. Conversely, if the Fed lowers rates to take away the incentive to chase higher money market yields, inflation will stay higher than it would have.
While investors worry over pending credit risks and high inflation, popular market-implied gauges provide no such warning – as we covered early in the banking crisis.
BB-rated corporate bond spreads, which are highly susceptible to credit risk contagion, trade near the average of the post-financial crisis era. The current U.S. BB-rated option-adjusted spread (OAS) is 3.42%, just a smidge above the 3.33% average from 2010; the COVID-19 high watermark was 8.37%, which pales in comparison to the 14.68% peak achieved in December 2008 during the midst of the Global Financial Crisis.
Bond investors are clearly not worried about credit risk. At least, not yet.
Source: Bank of America, Sam Ro of TKer
Bitcoin reclaims important level
When it comes to cryptocurrencies, Bitcoin has remained resilient after completing a short-term reversal pattern two weeks ago.
After successfully defending the prior-cycle highs from 2017, Bitcoin resolved higher from a base and rallied in the last week to the next line of resistance between $28,000 and $30,000.
This level represents where Bitcoin and other cryptocurrencies found support and rebounded during the last bull market in 2021.
With so much price memory at this level, former support could turn into resistance. A consolidation below this area would make sense.
If and when buyers absorb the overhead supply at this zone, we could anticipate a new leg higher. Until then, we could see some corrective price action from Bitcoin and other cryptocurrencies.
Source: All Star Charts
Capital markets on ice
The capital markets have been on ice since the regional banking crisis emerged nearly three weeks ago.
March is typically busy for new corporate debt financings: companies look to secure financing before the blackout period between the end of the first quarter and the kickoff of earnings season, when they typically refrain from bond sales. Lately, a lack of investor confidence, wild swings in the Treasurys market, the gradual reduction in liquidity, and the stress across the banking system have kept companies on the sidelines.
U.S. investment grade new issuance – those companies with the highest credit ratings – have sold $53.3 billion in new bonds this month, compared with March’s 5-year average of $179 billion.
High grade debt, high yield debt, and new equity issuance have all been cut to effectively nothing. M&A deal activity has continued as these were transactions already in the pipeline that have been worked on for months. But now the question becomes, who will be the financier if debt or borrowing is needed.
“Ultimately, financial conditions will tighten further, either via additional central-bank tightening as they try to tame inflation or via a deterioration in the current banking crisis,” said Seema Shah, chief global strategist at Principal Asset Management.
The Federal Reserve is watching lending conditions closely and will factor these developments into their decision-making process going forward. As Mr. Powell stated last week, “It’s possible that [bank stress] will contribute to significant tightening in credit conditions over time, and in principle that means monetary policy will have less work to do.”
Source: Apollo Global Management, Wall Street Journal
Active management underwhelms, again
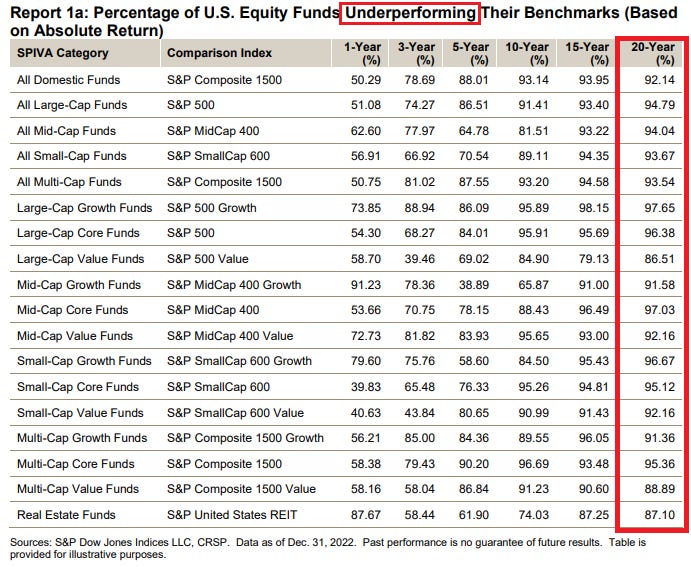
S&P Dow Jones Indices released their updated scorecard on active mutual funds.
The value of an investment manager’s active stock-picking abilities tends to be made clear during choppy or down markets. With markets down big last year, 2022 was a year in which active managers – particularly active domestic equities managers – had the chance to prove their mettle.
And according to the annual SPIVA report, many did – at least versus historical measures. But objectively speaking, the performance results from active managers across the entire landscape is still abysmal. When reviewing the 17 categories below, only 2 showed a majority (>50%) of active managers outperformed their respective benchmark in 2022.
Among the domestic equity categories, active U.S. small-cap core funds performed the best, with ~60% demonstrating outperformance. In the largest and most closely watched category, U.S. large-cap equities, nearly half of actively managed funds outperformed. This was the lowest underperformance rate since 2009 and the fourth best across more than two decades of SPDJI’s annual SPIVA Scorecards.
A large part as to why active management is so hard, especially over longer time frames, is most stocks underperform the index itself.
As Sam Ro points out:
One of the reasons for this is that most stocks don’t deliver above-average returns. According to S&P Dow Jones Indices, only 22% of the stocks in the S&P 500 outperformed the index itself from 2000 to 2020. Over that period, the S&P 500 gained 322%, while the median stock rose by just 63%.
Source: S&P Global, Charlie Bilello, Sam Ro of TKer
Mom and dad to the rescue
Almost half of American parents provide financial support to their children even after they’ve grown up, according to a recent survey by Savings.com. Of those children who remained financially reliant on their parents, the majority were between the age of 18 and 24, over one-third were 25 years or older, and 11% were at least 35.
Among those parents providing support, the average monthly total exceeds $1,400 on their adult kids’ expenses. While some parents provided minimal financial support, such as covering cell phone expenses or groceries, nearly half paid housing expenses averaging just over $800 per month.
Source: Savings.com, The Hill
That’s all for today.
Blake
Welcome to The Sandbox Daily, a daily curation of relevant research at the intersection of markets, economics, and lifestyle. We are committed to delivering high-quality and timely content to help investors make sense of capital markets.
Blake Millard is the Director of Investments at Sandbox Financial Partners, a Registered Investment Advisor. All opinions expressed here are solely his opinion and do not express or reflect the opinion of Sandbox Financial Partners. This Substack channel is for informational purposes only and should not be construed as investment advice. Clients of Sandbox Financial Partners may maintain positions in the markets, indexes, corporations, and/or securities discussed within The Sandbox Daily.


