

Current bull cycle in time and price, plus concentration bias, bond maturity profile, and higher prices coming again ?!?
The Sandbox Daily (2.27.2024)

Welcome, Sandbox friends.
Today’s Daily discusses:
current bull cycle in time and price
beware concentration bias
bond maturity schedule
more firms planning to raise prices
Let’s dig in.
Markets in review
EQUITIES: Russell 2000 +1.34% | Nasdaq 100 +0.21% | S&P 500 +0.17% | Dow -0.25%
FIXED INCOME: Barclays Agg Bond -0.13% | High Yield +0.13% | 2yr UST 4.699% | 10yr UST 4.307%
COMMODITIES: Brent Crude +1.07% to $83.41/barrel. Gold +0.03% to $2,039.5/oz.
BITCOIN: +4.79% to $57,129
US DOLLAR INDEX: -0.02% to 103.808
CBOE EQUITY PUT/CALL RATIO: 0.70
VIX: -2.26% to 13.43
Quote of the day
“People often say there's lots of uncertainty, but when was there ever certainty in the markets, the economy, or the future? I'm just trying to understand the present.”
- Bill Miller
Current bull cycle in time and price
U.S. equities remain extraordinarily resilient, and even the minor churning of the past couple weeks has now been resolved by a push back to new all-time highs for the major averages, led by Technology.
Some evidence of broadening out in the market is shown through other sectors, including Industrials, Financials, and Healthcare.
One method to measure this underlying resilience is looking at the New Highs and New Lows lists at the index level.
Just last week, we saw the greatest number of S&P 500 index constituents making New Highs (top pane). As for New Lows (bottom pane)? Non-existent.

All of this upside performance has led some investors to question if we are reaching a near-term top.
Since the market bottomed in October 2022, we’ve experienced two other rallies of similar time and magnitude.
The 1st rally lasted 16 weeks and resulted in a 20% rise before pulling back (regional bank crisis), while the 2nd rally returned 21% over the span of 19 weeks before rolling over (interest rates backing up).
The current rally is 17 weeks old – positive in 15 of those weeks – and up 23%.

Source: Hostile Charts, Fundstrat
Beware concentration bias
As the market’s heavyweights continue to grow and grow in market capitalization size, it has become problematic for investors to achieve true diversification through sector ETFs that are market-cap weighted.
5 of the 11 sectors in the S&P 500 index have one company possessing 20% or more of their respective sector’s weight. Meanwhile, Industrials are the most uniformly diversified sector with no single company owning a greater-than 5% weighting in the sector.
This means fewer and fewer stocks contribute and explain the returns in each sector.

Advice? Know what you own.
*Data as of December 2023
Source: Piper Sandler
Bond maturity schedule
One reason for the tightening delay in the monetary policy transmission mechanism coming from the Federal Reserve this cycle is the corporate debt refinancing that occurred during the pandemic, with one corporate treasury after another terming debt out into the future at generationally low interest rates.
Limited refinancing needs thus far meant that, at an aggregate level, companies have been shielded from the higher borrowing costs in today’s marketplace.
But this is starting to change – a growing volume of debt will need to be refinanced over the next few years, culminating in 2028-2029 which represents the peak of the maturity wall for both large-caps and small-caps.
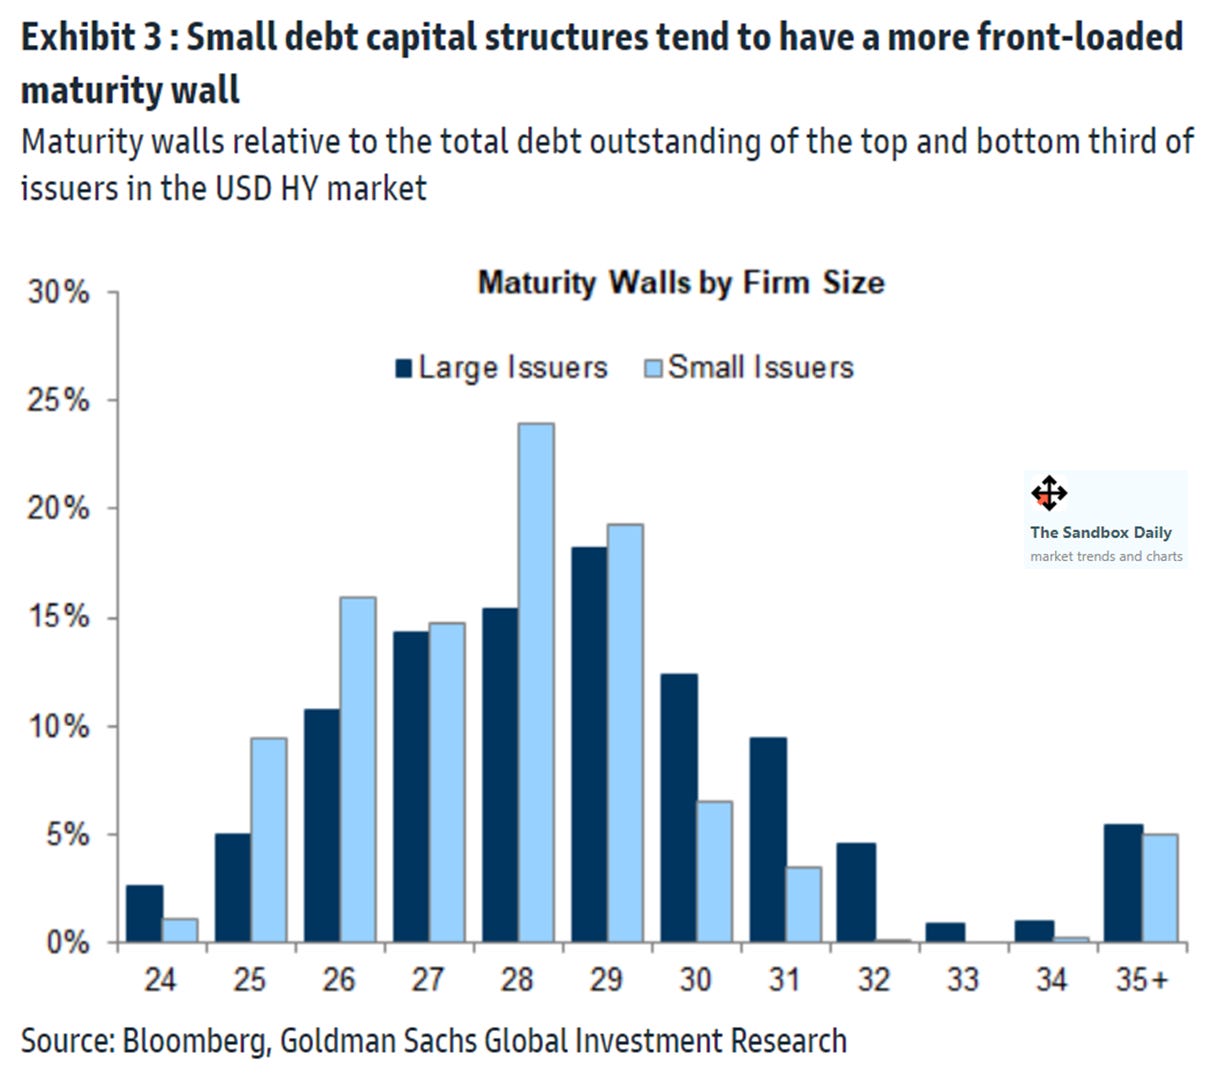
Most impacted by higher interest rate environments are the lowest rated issuers often referred to as High Yield, or Junk. Same maturity profile here.

And when looking at the S&P 500 index, 9 of the 11 sectors have 20% or more of their debt maturing in the next 3 years.
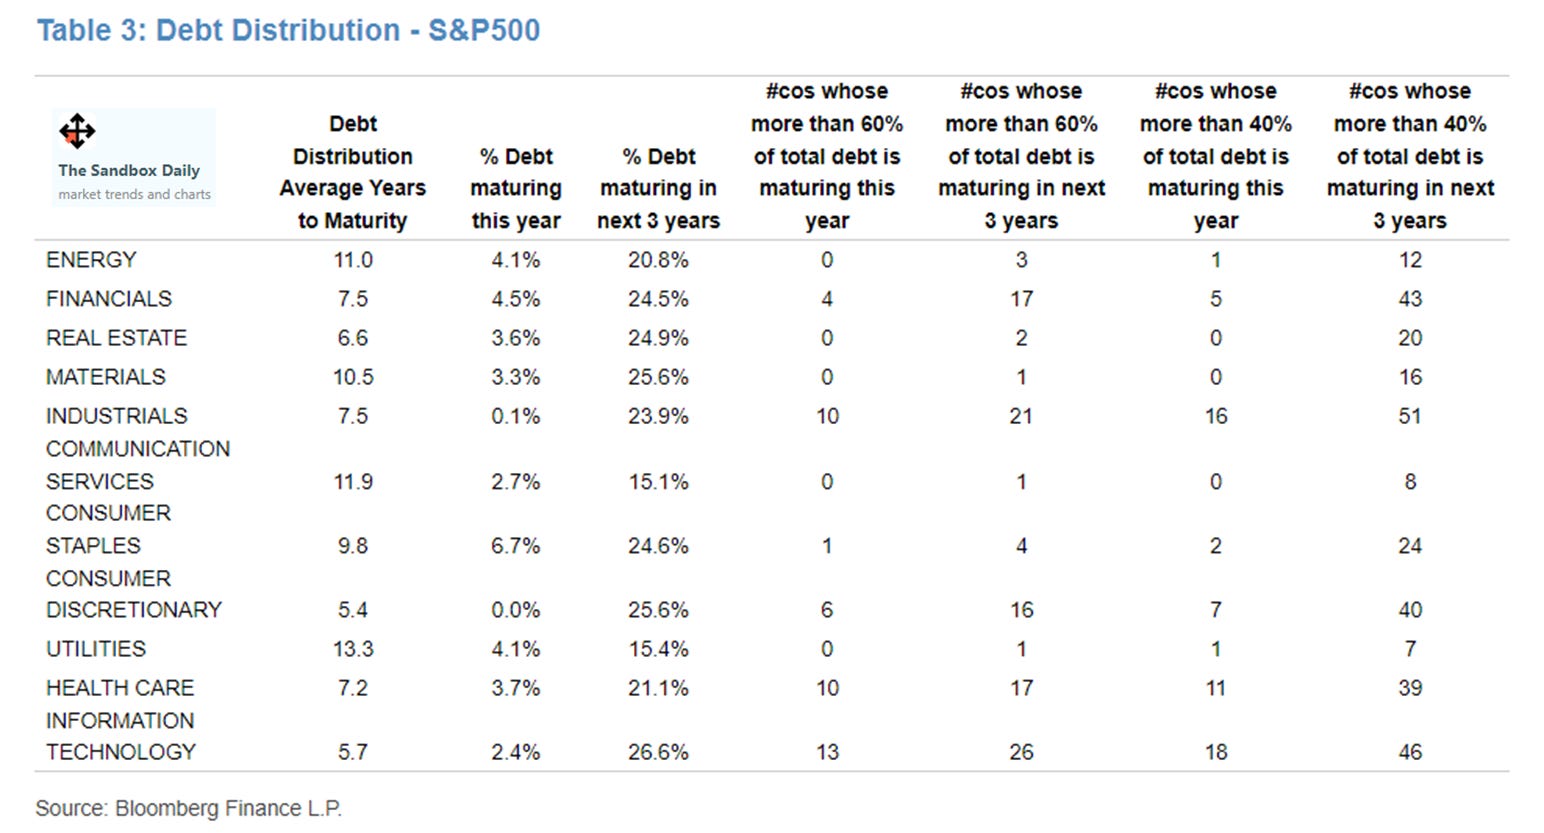
Source: J.P. Morgan Markets, Goldman Sachs Global Investment Research
More firms planning to raise prices
According to the National Federation of Independent Business (NFIB), a noticeable trend has emerged with these enterprises planning to increase their selling prices over the coming three months.
The survey of ~10,000 firms suggest a potential reacceleration in CPI inflation.
The NFIB survey results and CPI are highly correlated so it’s quite possible that CPI has some catching up to do, given their recent divergence.
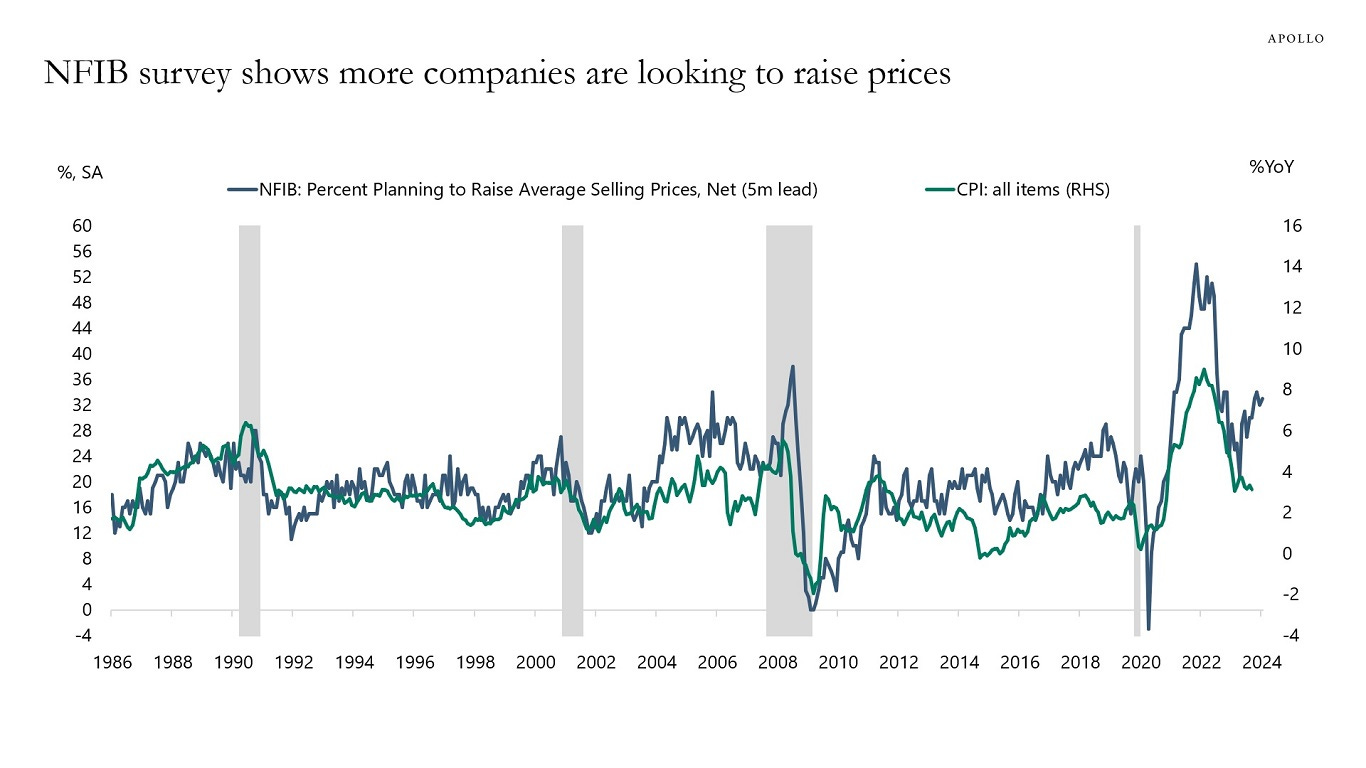
Source: Torsten Slok
That’s all for today.
Blake
Welcome to The Sandbox Daily, a daily curation of relevant research at the intersection of markets, economics, and lifestyle. We are committed to delivering high-quality and timely content to help investors make sense of capital markets.
Blake Millard is the Director of Investments at Sandbox Financial Partners, a Registered Investment Advisor. All opinions expressed here are solely his opinion and do not express or reflect the opinion of Sandbox Financial Partners. This Substack channel is for informational purposes only and should not be construed as investment advice. The information and opinions provided within should not be taken as specific advice on the merits of any investment decision by the reader. Investors should conduct their own due diligence regarding the prospects of any security discussed herein based on such investors’ own review of publicly available information. Clients of Sandbox Financial Partners may maintain positions in the markets, indexes, corporations, and/or securities discussed within The Sandbox Daily. Any projections, market outlooks, or estimates stated here are forward looking statements and are inherently unreliable; they are based upon certain assumptions and should not be construed to be indicative of the actual events that will occur.