

Debt ceiling impact, plus S&P 500 breaks out on absolute and relative basis, leading economic indicators, and mortgages
The Sandbox Daily (5.22.2023)

Welcome, Sandbox friends.
Today’s Daily discusses:
quantifying the debt ceiling impact
S&P 500 breaks out of its short-term range
U.S. large-cap stocks breakout relative to bonds
leading indicators warn of recession ahead (again)
mortgages account for most of recent increase in total consumer debt
Let’s dig in.
Markets in review
EQUITIES: Russell 2000 +1.22% | Nasdaq 100 +0.34% | S&P 500 +0.02% | Dow -0.42%
FIXED INCOME: Barclays Agg Bond -0.09% | High Yield +0.44% | 2yr UST 4.322% | 10yr UST 3.719%
COMMODITIES: Brent Crude +0.61% to $76.04/barrel. Gold -0.40% to $1,992.3/oz.
BITCOIN: -0.13% to $26,905
US DOLLAR INDEX: +0.04% to 103.244
CBOE EQUITY PUT/CALL RATIO: 0.56
VIX: +2.38% to 17.21
Quote of the day
“Investing is not about beating others at their game. It's about controlling yourself at your own game.”
- Benjamin Graham
Quantifying the debt ceiling impact
Time is running out for Congress to raise the debt ceiling. U.S. Treasury Secretary Janet Yellen has warned lawmakers that the government may not be able to service its debt obligations by June 1.

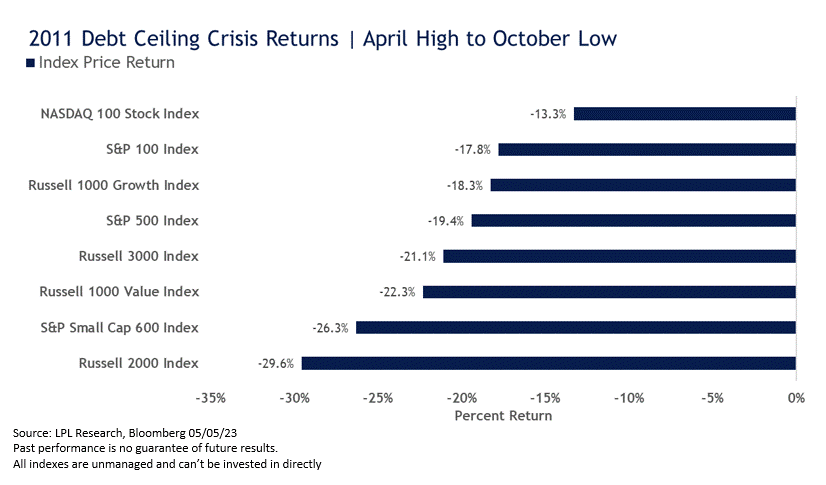
While many view a default as a very low probability event, the risk is not zero and many are looking to the 2011 debt ceiling crisis for what to expect.
As a refresher, a debt ceiling spring showdown in Washington resulted in the government hitting its debt limit on May 16, 2011. However, the Treasury pulled off some extraordinary accounting maneuvers to narrowly avert a crisis and fund the government until August 2nd, exactly how long it took Congress to get a deal done. The damage during this period included a meaningful sell-off across equity markets, lower yields amidst by a flight to safety, and a credit downgrade of U.S. debt to AA+ from AAA by Standard & Poor’s.
If the “X-date” comes with no progress from Congress, here are some of the biggest expenses that the country may not be able to pay in the first week and a half should the Treasury run out of reserves:

The United States has never defaulted on its bills before, so there’s no way to know exactly what would happen if it did.
Source: Washington Post, LPL Research
S&P 500 breaks out of its short-term range
Last week, the S&P 500 Index (SPX) reached its highest level since last August, led by the mega-cap tech stocks.
The S&P 500 finally broke out of its nearly 7-week, 3.5% trading range to the upside. Many had described this market as struggling for meaningful direction, noting this spring as “frustratingly neutral”, “stuck”, and “sideways choppiness.”

The lack of direction seems to fit with the moving pieces surrounding a number of the higher-profile themes, including the debt ceiling debate, Fed policy and forward guidance now that many expect the Fed to be done hiking interest rates this cycle, narrow technical participation, collapsing money supply growth, and a further tightening in lending standards.
Source: Beat the Bench, Dwyer Strategy
U.S. large-cap stocks breakout relative to bonds
With the S&P 500 breaking out to 9-month highs on an absolute basis (see above), the index is also breaking out relative to bonds.
This ratio chart shows stocks vs. bonds ($SPY/$TLT) closing at all-time highs after emerging from a 7-month base within a secular uptrend.

If stocks are in a bull market, you want to see them outperforming their alternative, and that's exactly what we're starting to see.
Source: Grindstone Intelligence, Bespoke Investment Group
Leading indicators warn of recession ahead (again)
The U.S. Leading Economic Indicators (LEI) index, compiled by the Conference Board, sank -0.6% in April. The decline was the 13th contraction in a row. The only instances we’ve had this many consecutive declines were the recessions that started in 1973 and 2007.
Furthermore, the annualized 6-month rate of change of the LEI remained in deep negative territory, posting -8.9%, only a modest uptick from -9.3% in the prior month. With the exception of 1951, declines of this magnitude have always been associated with recession.

The Conference Board publishes leading, coincident, and lagging indexes designed to signal peaks and troughs in the business cycle for major global economies. Many economists and investors track this measure closely.
As shown below, such a streak of consecutive monthly declines has led to 7 of the last 8 recessions. The pandemic-related recession is the outlier, but given the unexpected and somewhat random nature of the pandemic, it is not surprising that this indicator or any leading indicator could not forecast it.

The rate of decline in the LEI and the weak indicator breadth are historically consistent with falling economic activity. The Conference Board expects further economic softness in the coming months and a recession start in mid-2023.
Clearly the forward-looking indicators suggest enduring, widespread weakness across the economy. While no forecasting system is perfect, this one has a pretty good track record.
Source: The Conference Board, Ned Davis Research, Liz Ann Sonders
Mortgages account for most of recent increase in total consumer debt
Last week, the New York Fed released its Quarterly Report on Household Debt and Credit which shows U.S. consumer debt has been steadily rising since the pandemic – climbing to $17.05 trillion in the 1st quarter of 2023, an increase of $2.9 trillion since the 4th quarter of 2019.
The faster-than-usual increase in consumer debt over the past three years was mainly driven by a record volume of mortgage originations, as many households took advantage of historically low rates to refinance their mortgage and even take out some cash in the process.

According to the New York Fed, 14 million mortgages were refinanced during the pandemic refinancing boom, during which homeowners extracted $430 billion through cash-out refinances. As a result, mortgages accounted for 86% of the increase in total consumer debt since Q4 2019, followed by credit card debt and student loans, which accounted for 8% and 3% of the increase, respectively.
Source: Federal Reserve Bank of New York, Statista
That’s all for today.
Blake
Welcome to The Sandbox Daily, a daily curation of relevant research at the intersection of markets, economics, and lifestyle. We are committed to delivering high-quality and timely content to help investors make sense of capital markets.
Blake Millard is the Director of Investments at Sandbox Financial Partners, a Registered Investment Advisor. All opinions expressed here are solely his opinion and do not express or reflect the opinion of Sandbox Financial Partners. This Substack channel is for informational purposes only and should not be construed as investment advice. Clients of Sandbox Financial Partners may maintain positions in the markets, indexes, corporations, and/or securities discussed within The Sandbox Daily.