Debt ceiling, plus a market of stocks, weak demand, Friday's jobs report, and the past vs. the present
The Sandbox Daily (5.8.2023)
Welcome, Sandbox friends.
Today’s Daily discusses:
brief history of the debt ceiling
stocks showing strength
weak demand mentions soar
Friday’s employment report dashes hope for July rate cut
how we view the past vs. the future
Let’s dig in.
Markets in review
EQUITIES: Nasdaq 100 +0.25% | S&P 500 +0.05% | Dow -0.17% | Russell 2000 -0.31%
FIXED INCOME: Barclays Agg Bond -0.55% | High Yield -0.28% | 2yr UST 4.005% | 10yr UST 3.513%
COMMODITIES: Brent Crude +1.73% to $76.60/barrel. Gold +0.19% to $2,028.7/oz.
BITCOIN: -4.96% to $27,452
US DOLLAR INDEX: +0.17% to 101.386
CBOE EQUITY PUT/CALL RATIO: 0.69
VIX: -1.22% to 16.98
Quote of the day
“Habits are the compound interest of self-improvement.”
- James Clear, Atomic Habits
Brief history of the debt ceiling
The market remains focused on tomorrow’s White House summit to discuss raising the $31.4 trillion debt ceiling, with the Biden administration and leaders from Capitol Hill coming together to bring resolution to this long-awaited deadline. Congress must raise the debt ceiling before the government runs out of money to pay its bills, which could happen as soon as June 1st as announced by Treasury Secretary, Janet Yellen.
The debt ceiling has been modified 101 times since the first federal debt limit was set at $45 billion in July 1939. The debt ceiling policy came out of the need to accrue more debt during the world wars, before which Congress had to approve borrowing specifically for each purpose. Despite partisan disagreements, Congress and the president have never officially allowed the U.S. to default on its debt.
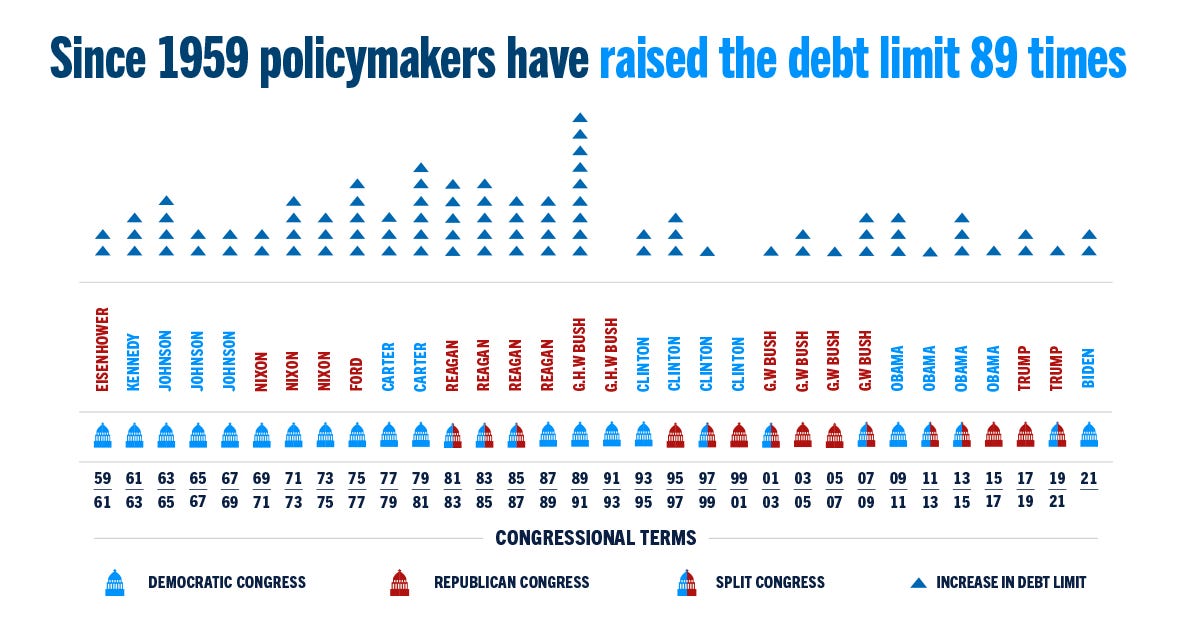
Reviewing more recent history, policymakers have raised the debit limit 89 times since 1959. The limit has been raised under all combinations of leadership and during both bull and bear markets:
Bottom line, the deal can get done in this divisive political climate and not disrupt financial markets.
Source: Wall Street Journal, Peter G. Peterson Foundation
Finding strength under the hood
We’ve written about the narrow market breadth plaguing this rally for several months, so today we dive under the hood and look at the individual stocks showing the greatest short-term strength. After all, the stock market is a market of stocks and there are plenty of stocks showing both absolute and relative strength.
The “Hall of Famers” list from All Star Charts is composed of the 150 largest US-based stocks with several technical filters applied so the strongest stocks with the most momentum rise to the top; this list doesn’t include ADR’s or any stock domiciled outside the United States.
Here is what J.C. Parets, CEO of All Star Charts, had to say:
When they tell you that it’s only a handful of companies holding up this market, they are lying to you.
When you review this stock scan a little closer, you will notice it’s not just Meta Platforms (META), Nvidia (NVDA), Apple (AAPL), etc.
There are scores of large-cap stocks across many different sectors that find themselves within 5% of new 52-week highs while showing upward strength and momentum.
Source: All Star Charts
Weak demand mentions soar
Savita Subramanian, head of U.S. equity and quantitative strategy at Bank of America Securities, said that “mentions of weak demand soared to record levels” so far this earnings season.
The mentions of tepid demand this earnings season is even higher than during the COVID-19 pandemic and Great Financial Crisis.
Corporate optimism remains surprisingly strong about the consumer. This earnings season has shown that pricing power and cost cuts have helped maintain margins for many companies, but after a period of prolonged inflationary pressures, aggregate demand may/will inevitably soften. Perhaps the corporate C-Suites across America are finally sending that message to shareholders.
Source: Wall Street Journal
Friday’s employment report dashes hope for July rate cut
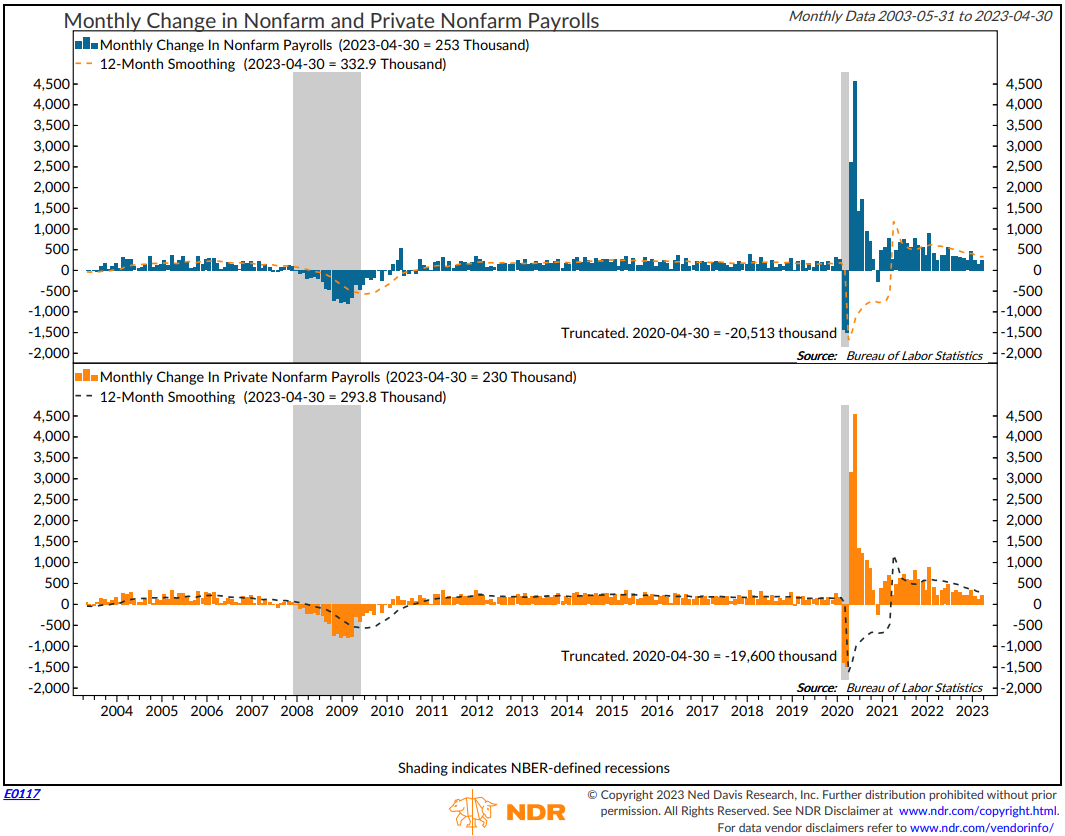
Friday’s employment report revealed that nonfarm payrolls expanded by 253,000 in April, well above the consensus expectation of 180,000 increase.
Meanwhile, the unemployment rate fell to 3.4% – its lowest level since May 1969 – while average hourly earnings rose +0.5%, their fastest pace in a year and bringing the YoY change to +4.4%.
A gradual slowdown in hiring and wage trends, coupled with a cyclical low in unemployment, should keep the Fed on their hawkish narrative.
Before Friday’s report, Fed Funds futures priced in a 60% chance of a rate cut at the July FOMC meeting. Those odds fell sharply to settle near 35% following further evidence of a resilient labor market.
While the employment report lowers the chance of rate cuts coming sooner than later, it’s not enough to increase the likelihood of further rate hikes, either. Given the Fed’s stated emphasis on incoming data to drive decision-making, expectations priced into the Fed Funds Futures market may see higher bouts of volatility going forward.
Source: Bureau of Labor Statistics, Ned Davis Research, Bloomberg, CME FedWatch Tool
How we view the past vs. the future
The past seems so obvious since hindsight provides visibility to all the missed opportunities.
Yet, looking into the future, everything seems ambiguous and unpredictable. And this feeling of uncertainty breeds feelings of "risk."
If we use the past as a rough guide for the future, we can build a gameplan based on reasonable expectations and probabilities which allow us to endure the uncertainty of markets and weather the difficult storms along the way.
Source: Sandbox Financial Partners
That’s all for today.
Blake
Welcome to The Sandbox Daily, a daily curation of relevant research at the intersection of markets, economics, and lifestyle. We are committed to delivering high-quality and timely content to help investors make sense of capital markets.
Blake Millard is the Director of Investments at Sandbox Financial Partners, a Registered Investment Advisor. All opinions expressed here are solely his opinion and do not express or reflect the opinion of Sandbox Financial Partners. This Substack channel is for informational purposes only and should not be construed as investment advice. Clients of Sandbox Financial Partners may maintain positions in the markets, indexes, corporations, and/or securities discussed within The Sandbox Daily.


