

Divergences among the major indexes, plus the Fed's inflation measure, aging demographics, and the yield curve reshaping
The Sandbox Daily (1.26.2024)

Welcome, Sandbox friends.
Today’s Daily discusses:
divergences across indexes
PCE inflation continues to moderate
aging demographics
yield curve reshaping impact on equities
Let’s dig in.
Markets in review
EQUITIES: Dow +0.16% | Russell 2000 +0.12% | S&P 500 -0.07% | Nasdaq 100 -0.55%
FIXED INCOME: Barclays Agg Bond -0.11% | High Yield -0.08% | 2yr UST 4.357% | 10yr UST 4.141%
COMMODITIES: Brent Crude +1.37% to $83.56/barrel. Gold +0.03% to $2,037.5/oz.
BITCOIN: +5.27% to $41,962
US DOLLAR INDEX: -0.11% to 103.459
CBOE EQUITY PUT/CALL RATIO: 0.67
VIX: -1.41% to 13.26
Quote of the day
“Once price enters uncharted territory, there’s virtually no price memory or overhead supply to prevent it from trending higher.”
- Patrick Dunuwila, CMT, Editor of The Chart Report
Divergences across indexes
The S&P 500, Dow Jones Industrial Average, and Nasdaq 100 attaining new all-time high territory has not yet been followed by similar movement from the Russell 2000, Value Line Average, and Dow Jones Transportation Average. This divergence will be important to concentrate on in the coming weeks and months.
The small-cap divergence from the major index average’s push to new highs is notable, especially as the soft landing narrative gains traction and a change in monetary policy looks inevitable in 2024 – tailwinds strongly supporting stocks further down the cap stack.
Historically, when the S&P 500 index trades to new all-time highs following a bear market, small-caps tend to follow, on average only -2.3% below their own all-time highs.
Currently, small-caps remain ~20% below their all-time highs.

Source: Fundstrat
PCE inflation continues to moderate
The Federal Reserve’s preferred gauge of underlying inflation cooled to an almost 3-year low even with robust holiday spending.
The Core Personal Consumption Expenditures Price (PCE) index, which strips out the volatile food and energy components, increased +0.2% MoM and +2.9% YoY. In fact, Core PCE price readings in 6 of the last 7 months have been running at an annualized monthly rate equal to or below the Federal Reserve’s mandated 2% target.
Whichever measure of inflation you track (see below), prices are moderating back to normal levels.

Consumers have been unfazed by higher interest rates, tighter lending standards, and other headwinds, such as the resumption of student loan payments a few months ago.
Investors expect the Fed will cut rates this spring in part because inflation has declined much faster than the central bank anticipated over the last 6-12 months.
Nearly all the eco-data released in recent weeks tell the same story: inflation vanishing alongside steady economic activity.
Source: Wall Street Journal
Aging demographics
The economic challenges of aging demographics are well understood and are expected to persist in the developed world, as well as in China, in the coming decade. Their most overlapping manifestation is slower labor force growth, which implies slower potential output growth.
The International Labor Organization projects 0.4%-0.5% annual labor force growth in the United States, United Kingdom, and Eurozone through 2030, while Japan and China should see their labor force shrink by 0.6% and 0.7% per year, respectively.
The old age dependency ratio (population age 65+ to ages 15-64) is projected to increase across the globe over the next two decades.
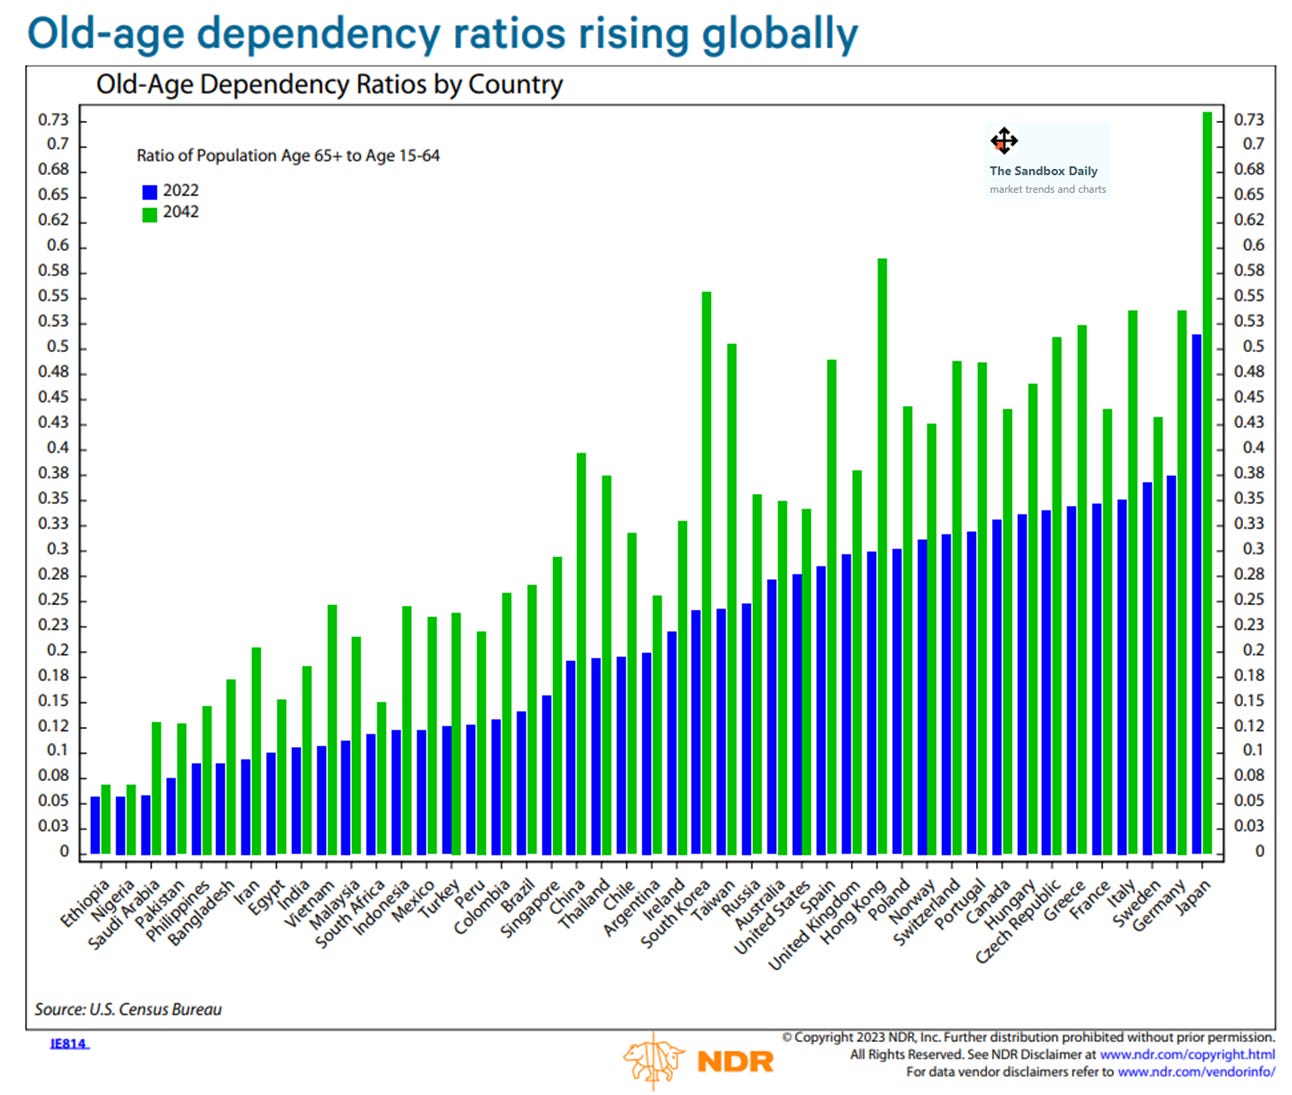
Source: Ned Davis Research
Yield curve reshaping impact on equities
Many investors express concern about how a steepening and normalizing yield curve – one that reshapes from inverted to positively sloped – will affect equities, especially given the negative recent correlation between stocks and bond yields. Meaning, as yield rise, stock prices fall.
Goldman Sachs argues economic growth, rather than movements in the yield curve, matters more for equity returns. As they put it:
Equity investors focused on the implications of yield curve reshaping should follow the advice offered 32 years ago by James Carville, the manager for then-candidate Bill Clinton’s successful 1992 Presidential campaign: “It’s the economy, stupid.”
Investors are focused on the prospects for the yield curve to normalize its shape because that has often signaled a recession.
There have been 15 instances of yield curve slope normalization since 1962. In these episodes, the 2-10 yield curve normalized by a median of 7 months prior to recession.
For context, the current period of yield curve inversion began in July 2022, and after 19 months ranks as the longest inversion since 1980.

S&P 500 returns have typically been positive during the 6 months before yield curve normalization, returning a median of +3% and rising in 9 of 15 episodes.
Equities have continued to rise after yield curve un-inversion if the U.S. economy did not enter a recession soon thereafter.
The U.S. economy entered a recession within the following 12 months in 9 of the 15 historical episodes of yield curve un-inversions. For these experiences, the S&P 500 returned a median of +4% after 3 months but -2% after 6 months.
In contrast, the median 3- and 6-month returns after yield curve un-inversion if the economy avoided a recession equaled +1% and +2%, respectively.
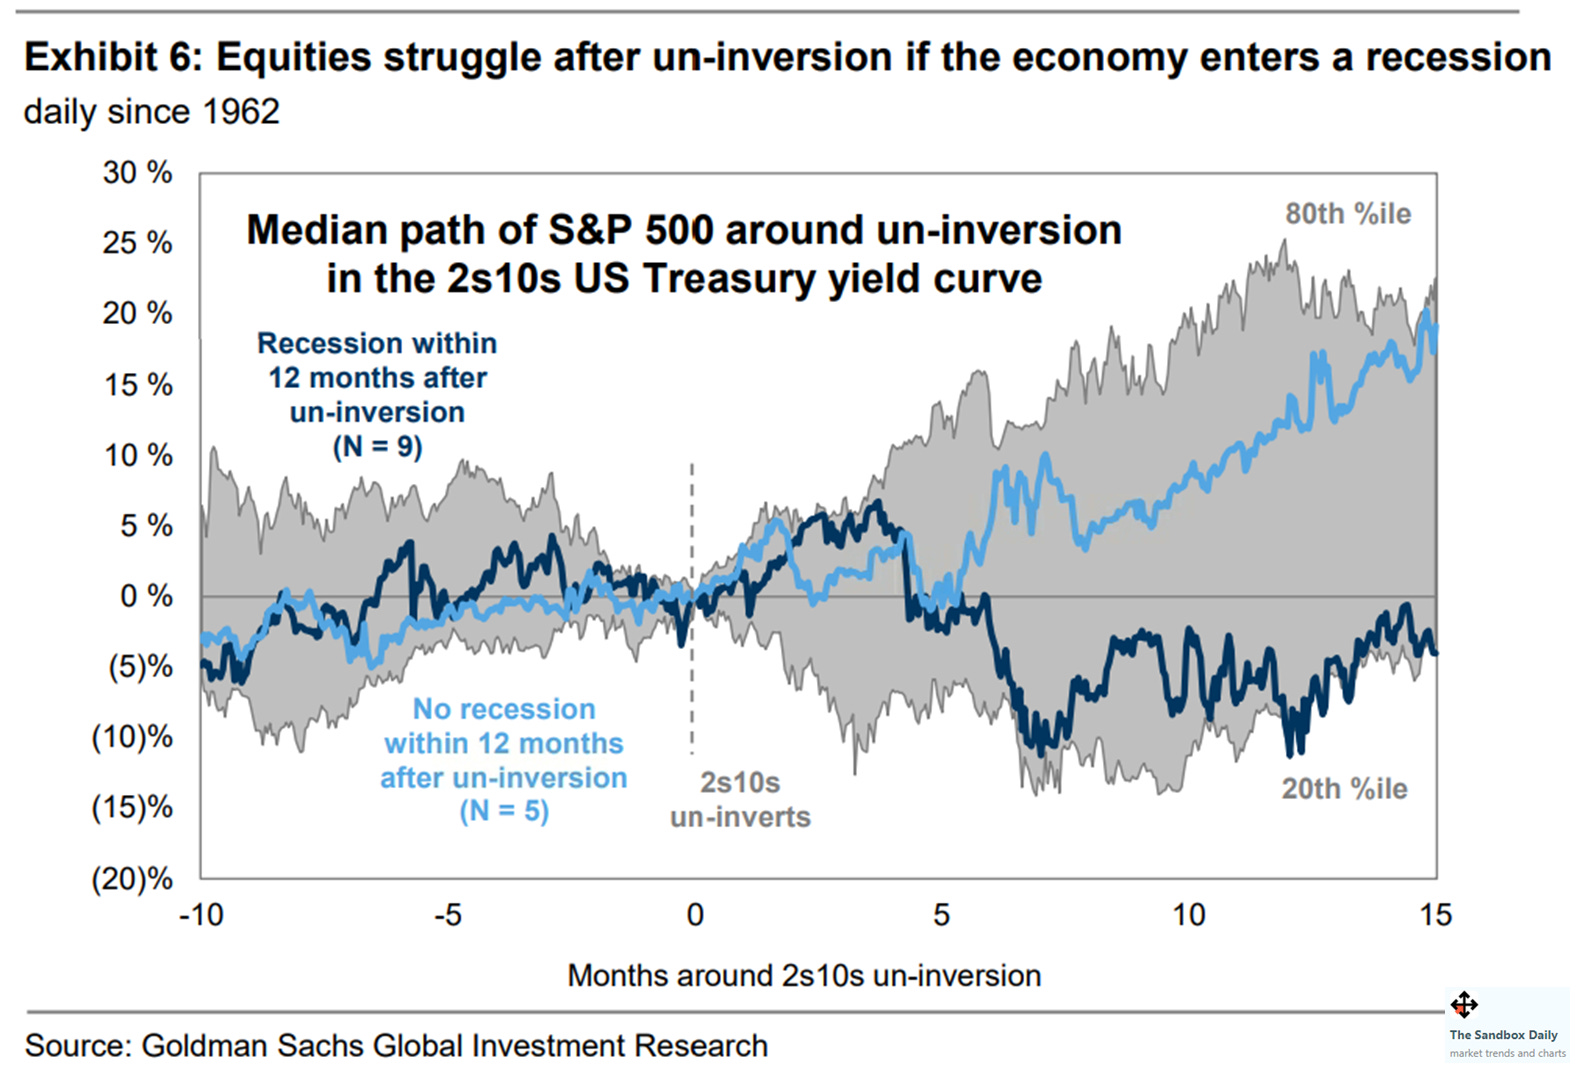
Source: Goldman Sachs Global Investment Research
That’s all for today.
Blake
Welcome to The Sandbox Daily, a daily curation of relevant research at the intersection of markets, economics, and lifestyle. We are committed to delivering high-quality and timely content to help investors make sense of capital markets.
Blake Millard is the Director of Investments at Sandbox Financial Partners, a Registered Investment Advisor. All opinions expressed here are solely his opinion and do not express or reflect the opinion of Sandbox Financial Partners. This Substack channel is for informational purposes only and should not be construed as investment advice. The information and opinions provided within should not be taken as specific advice on the merits of any investment decision by the reader. Investors should conduct their own due diligence regarding the prospects of any security discussed herein based on such investors’ own review of publicly available information. Clients of Sandbox Financial Partners may maintain positions in the markets, indexes, corporations, and/or securities discussed within The Sandbox Daily. Any projections, market outlooks, or estimates stated here are forward looking statements and are inherently unreliable; they are based upon certain assumptions and should not be construed to be indicative of the actual events that will occur.