Do you buy the dip ?!?, plus crypto liquidations and it's time for the Fed
The Sandbox Daily (8.6.2024)
Welcome, Sandbox friends.
From Meltdown Monday to Turnaround Tuesday, equities bounced back from yesterday’s difficult trading session, Democratic president hopeful Kamala Harris picked Minnesota Governor Tim Walz for vice president, and trading volume in 401(k)s on Monday was more than eight times the daily average – the highest since March 2020.
Today’s Daily discusses:
summertime blues
crypto traders liquidated, while BlackRock bitcoin holders unfazed
Fed, it’s time to get going
Let’s dig in.
Markets in review
EQUITIES: Russell 2000 +1.23% | S&P 500 +1.04% | Nasdaq 100 +1.02% | Dow +0.76%
FIXED INCOME: Barclays Agg Bond -0.60% | High Yield +0.38% | 2yr UST 3.989% | 10yr UST 3.897%
COMMODITIES: Brent Crude +0.09% to $76.37/barrel. Gold -0.51% to $2,432.1/oz.
BITCOIN: +2.88% to $56,376
US DOLLAR INDEX: +0.22% to 102.915
CBOE EQUITY PUT/CALL RATIO: 0.77
VIX: -28.16% to 27.71
Quote of the day
“Volatility doesn’t wear a sign around its neck or call ahead. It simply arrives, in a different guise nearly every time.”
- Josh Brown, The Only Reason Investing Works is Because Things Can Go Wrong
Summertime blues
This recent market correction has come after one of the longest periods without a 5% drawdown in the past 20 years.
Until mid/late July, the S&P 500 was on track towards one of its best starts ever:
The speed and magnitude of the equity selloff / volatility spike indicates selling pressure from systematic investors and options positioning were the primary contributors.
Many investors are now asking what they should do next.
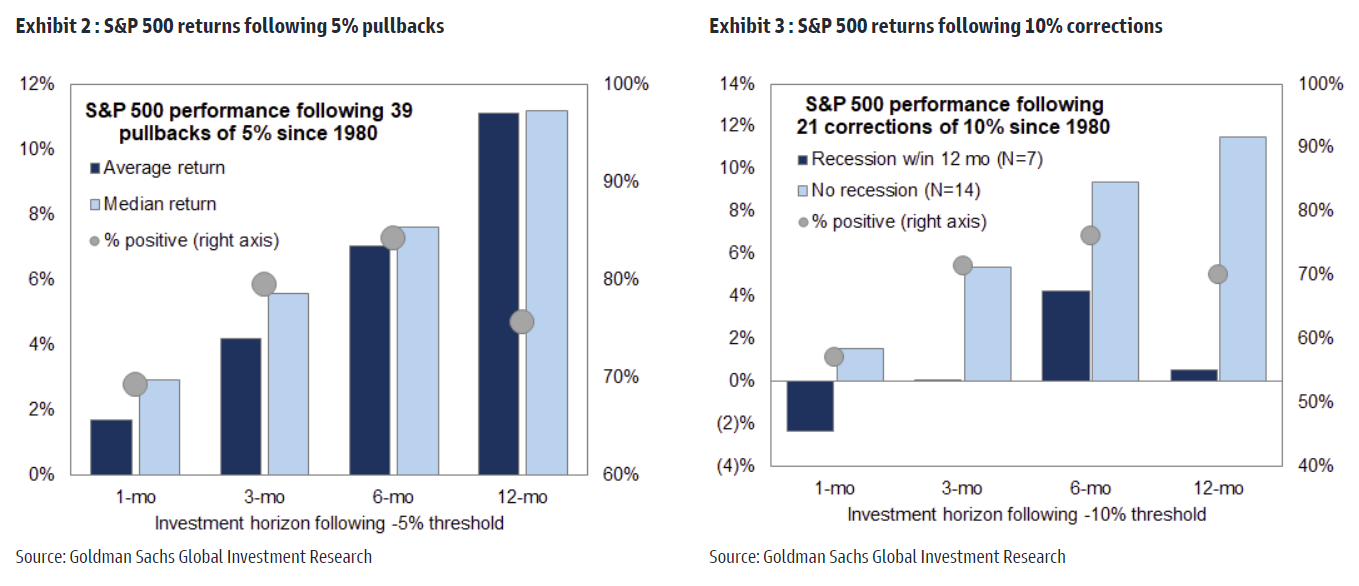
Historical precedence shows that investors typically profit when buying the S&P 500 index following 5% selloffs AND 10% selloffs.
Since 1980, an investor buying SPX 5% below its recent high would have generated a median return of 6% over the following three months with a hit ratio of 84%.
Similarly, 10% corrections from its recent high enjoy roughly the same results – assuming no recession – which is our base case.
Source: Goldman Sachs Global Investment Research
Crypto traders liquidated as market cap registers largest daily drop since 2022
Over half of the 50 largest cryptocurrencies by market capitalization were in the red following the biggest crypto selloff in well over a year.
The entire crypto market saw a $510 billion drop in total market capitalization. Following the sell-off, ~60% of the top 50 cryptocurrencies lost all the gains made during 2024.
And yet, the BlackRock iShares Bitcoin Trust (IBIT) – an ETF that directly invests in bitcoin within a traditional brokerage account and is marketed to more traditional finance folks – recorded zero outflows yesterday.
Last week, the iShares Bitcoin Trust lost -8.2%. Over the weekend, spot bitcoin lost another -14%. On Monday, shareholders of $IBIT did not panic, as if shouting alongside William Wallace: “HHOOOOLLLLLLLDDDDDDDDDD !!!”
Bloomberg’s senior ETF analyst, Eric Balchunas, had this to say of the events:
“Compared to some of these degens, these boomers are like the Rock of Gibraltar. You guys are so lucky to have them.”
Source: The Block, CNBC, Eric Balchunas
Fed, it’s time to get going
Global central banks have been cutting interest rates at their fastest pace since the early days of the 2020 covid-19 pandemic.
Central banks have conducted 35 interest rate cuts over the last three months, exceeding the amount of activity in Q1 earlier this year.
Since 2000, the most cuts we experienced was May 2020 when global rates were reduced 92 times. Before that? The Global Financial crisis, when central banks implemented 76 cuts in 2009.
Absent from the easing party? The Federal Reserve.
A slew of U.S. economic indicators have been pointing to moderating economic growth. To name a few, payrolls growth has been trending down for some time, and so have wages and disposable personal income. Consumer confidence has been weakening. Manufacturing has been in a slump. Housing market activity (both construction and sales) has suffered from high mortgage rates. These trends reflect the lagged effects of restrictive Fed policy and the runoff of fiscal support, including the end of excess savings from the pandemic.
While there is not sufficient evidence for the Fed to rush a rate cut this week or next, the Fed needs to normalize policy now that economic risks are much more balanced.
Source: Winfield Smart
That’s all for today.
Blake
Welcome to The Sandbox Daily, a daily curation of relevant research at the intersection of markets, economics, and lifestyle. We are committed to delivering high-quality and timely content to help investors make sense of capital markets.
Blake Millard is the Director of Investments at Sandbox Financial Partners, a Registered Investment Advisor. All opinions expressed here are solely his opinion and do not express or reflect the opinion of Sandbox Financial Partners. This Substack channel is for informational purposes only and should not be construed as investment advice. The information and opinions provided within should not be taken as specific advice on the merits of any investment decision by the reader. Investors should conduct their own due diligence regarding the prospects of any security discussed herein based on such investors’ own review of publicly available information. Clients of Sandbox Financial Partners may maintain positions in the markets, indexes, corporations, and/or securities discussed within The Sandbox Daily. Any projections, market outlooks, or estimates stated here are forward looking statements and are inherently unreliable; they are based upon certain assumptions and should not be construed to be indicative of the actual events that will occur.


Cool charts and info. That one about IBIT surprised me. That is good news, because as the ETF's were getting listed there was a narrative that those IBIT holders would be the first to sell if things got rocky. I guess not!
Great stuff!