

Earnings season update, plus consumer spending, debt ceiling, household balance sheets, and the options market
The Sandbox Daily (4.24.2023)

Welcome, Sandbox friends.
Today’s Daily discusses:
early Q1 earnings update
consumer goods spending, three years post-pandemic
shopping for insurance against a debt-ceiling failure
U.S. household balance sheets remain in good condition
zero-dated options are taking the market by storm
Let’s dig in.
Markets in review
EQUITIES: Dow +0.20% | S&P 500 +0.09% | Russell 2000 -0.15% | Nasdaq 100 -0.24%
FIXED INCOME: Barclays Agg Bond +0.39% | High Yield +0.28% | 2yr UST 4.118% | 10yr UST 3.501%
COMMODITIES: Brent Crude +1.18% to $82.62/barrel. Gold +0.45% to $1,999.4/oz.
BITCOIN: -0.23% to $27,458
US DOLLAR INDEX: -0.45% to 101.362
CBOE EQUITY PUT/CALL RATIO: 0.61
VIX: +0.72% to 16.89
Quote of the day
“Change is the law of life. And those who look only to the past or the present are certain to miss the future.”
- John F. Kennedy
Early Q1 earnings update
Stocks remain in a holding pattern as investors brace for an incoming wave of Big Tech earnings.
Earnings season is ramping up, with 59 companies in the S&P 500 Index (SPX) having reported results last week and another 178 companies – 42% of the index’s market capitalization – reporting this week. Marquee names are reporting results every day, including Microsoft (MSFT), Alphabet (GOOGL), Meta Platforms (META), and Amazon (AMZN) front and center.

The performance of S&P 500 companies continues to be mixed, although better-than-feared, as we begin the heart of Q1 earnings season.

Of the 18% of companies in the S&P 500 that have reported, 78% have reported actual EPS above estimates, which is slightly above the 5-year average of 77% and the 10-year average of 73%. In aggregate, companies are reporting earnings that are +6.0% above estimates, which is below the 5-year average of +8.6%, and below the 10-year average of +6.4%. In other words, more companies are beating estimates but by smaller amounts, on average.

The blended earnings decline (blended combines actual results for companies that have reported and estimated results for companies that have yet to report) for the 1st quarter is -5.9% today, which would mark the 2nd consecutive quarter in which the index has reported a decrease in earnings – so the earnings recession is here, as expected.

Key themes are emerging: corporate cost-cutting and efficiency actions are paramount, a weaker Dollar helps, lower interest rates a tailwind, easing input prices and supply chain pressures boost margins, and deploying cash on stock buybacks to satisfy shareholders. Wages remain a lingering key issue. Oh yeah, mention the term “AI” as many times as possible.
Full-year earnings estimates for the S&P 500 have largely held at around the $220 level set in early April; this and next week’s announcements will surely test these sell-side estimates.
Source: Earnings Whispers, FactSet, Fundstrat
Consumer goods spending, three years post-pandemic
It is no secret the consumer is still spending strongly, even if there are signs of slowing, despite historically high inflation and a Federal Reserve that is determined to slow the economy through interest rate hikes and Quantitative Tightening measures.
Consumer goods consumption is roughly 10% above trend (~$500bn) after peaking at +15% in the first half of 2021. The conventional narrative involves two simple, temporary factors: a pandemic-driven shock to consumer preferences and unprecedented fiscal stimulus. But while the pandemic-preference shift and temporary stimulus explanations certainly contributed, the elevated level of goods consumption three years into the pandemic and over a year after most pandemic transfer payments expired suggests something else is afoot.

Perhaps another reasonable explanation is sustainably stronger consumer finances. One cannot ignore the improved financial footing of lower- and middle-income consumers – in terms of real income trends, balance sheets, and cash flows – as another overarching reason why goods consumption remains elevated.
Goldman Sachs estimates real compensation growth (inflation-adjusted) at the low end of wages is up ~6.2% since 2019, compared to the 2.7% average over the previous two decades.
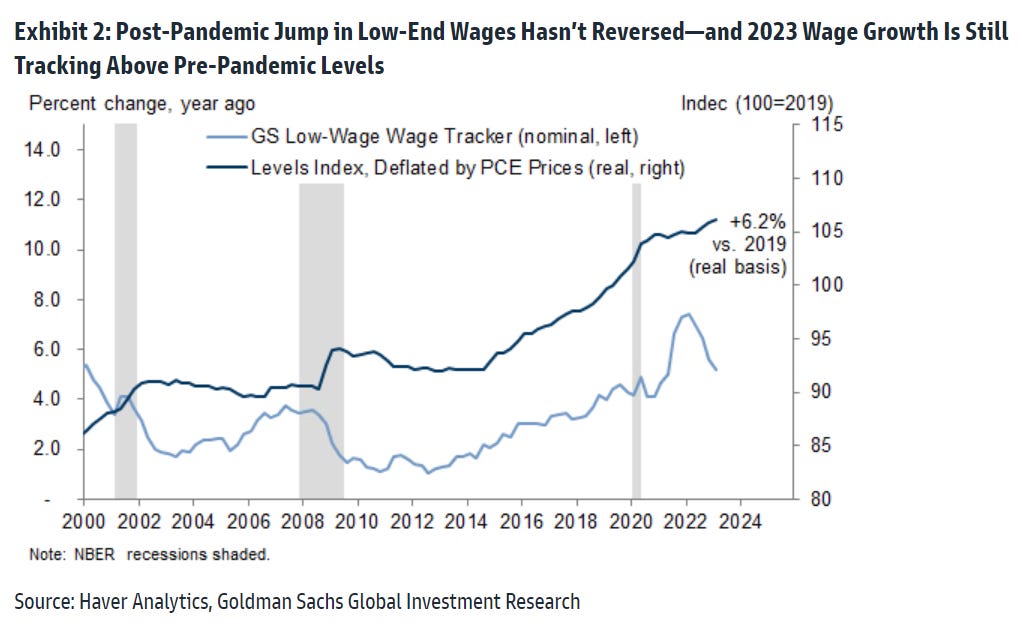
This implies a wide swath of people have more spending power than ever before in their working careers, which is encouraging for the growth outlook because this segment historically has a higher propensity to consume any additional, incremental income.
Source: Goldman Sachs Global Investment Research
Shopping for insurance against a debt-ceiling failure
As early reports on tax collections remain disappointing and the debt ceiling debate rages on, the market is bracing for a sooner-than-expected default deadline.
That puts even more pressure on Capitol Hill and the White House to figure out a debt ceiling deal. Back in January, Treasury Secretary Janet Yellen said the government can pay its bills only through early June without an increase.
Now, the cost of insuring U.S. debt against a default – via a credit-default swap contract over the next 6 months – has soared to the highest on record.

If no one thinks the United States Treasury will default on its obligations, this insurance should be ultracheap. Perhaps nobody would bother buying it at all – which is why CDS spreads are generally negligible. But as the risk of default becomes a real possibility, the price and the number of buyers are climbing – paying the equivalent of a premium on the insurance contract known as a credit-default swap to protect themselves in the event that Congress fails to strike a compromise and raise the debt ceiling.
Source: Michael McDonough, Wall Street Journal
U.S. household balance sheets remain in good condition
The balance sheet of U.S. households remain in great shape.
The ratio of liabilities to net wealth has declined 50% since the 2008 financial crisis, and household leverage is currently at levels last seen in the early 1980s, as shown below.

If the unemployment rate rises, consumer spending will slow down and net wealth will decline, but the starting point for U.S. households comes from a strong starting position.
Source: Apollo Global Management
ODTE are taking the market by storm
Both Goldman Sachs and Bloomberg have been reporting on the growing popularity among retail investors for “0DTE,” or options contracts with “zero days until expiration.” These are put-and-call options on individual stocks and indexes that expire within a day.
As this chart below shows, 46% of all options traded expire in 6.5 hours or less, a new all-time high.

This trading activity has accelerated significantly in prominence after the COVID crash.
Source: ZeroHedge
That’s all for today.
Blake
Welcome to The Sandbox Daily, a daily curation of relevant research at the intersection of markets, economics, and lifestyle. We are committed to delivering high-quality and timely content to help investors make sense of capital markets.
Blake Millard is the Director of Investments at Sandbox Financial Partners, a Registered Investment Advisor. All opinions expressed here are solely his opinion and do not express or reflect the opinion of Sandbox Financial Partners. This Substack channel is for informational purposes only and should not be construed as investment advice. Clients of Sandbox Financial Partners may maintain positions in the markets, indexes, corporations, and/or securities discussed within The Sandbox Daily.