

Economic surprises, plus outstanding debt composition, oil production, and ETF investor data
The Sandbox Daily (2.1.2024)

Welcome, Sandbox friends.
Today’s Daily discusses:
economic surprises remain positive globally
Federal Reserve can’t overcome existing debt composition
record U.S. oil production helps tame prices
ETF investor data
Let’s dig in.
Blake
Markets in review
EQUITIES: Russell 2000 +1.39% | S&P 500 +1.25% | Nasdaq 100 +1.21% | Dow +0.97%
FIXED INCOME: Barclays Agg Bond +0.57% | High Yield +0.58% | 2yr UST 4.211% | 10yr UST 3.882%
COMMODITIES: Brent Crude -2.01% to $78.93/barrel. Gold +0.24% to $2,072.3/oz.
BITCOIN: +1.06% to $42,982
US DOLLAR INDEX: -0.18% to 103.085
CBOE EQUITY PUT/CALL RATIO: 0.64
VIX: -3.28% to 13.88
Quote of the day
“The best way to measure your investing success is not by whether you’re beating the market but by whether you’ve put in place a financial plan and a behavioral discipline that are likely to get you where you want to go.”
- Benjamin Graham
Economic surprises remain positive globally
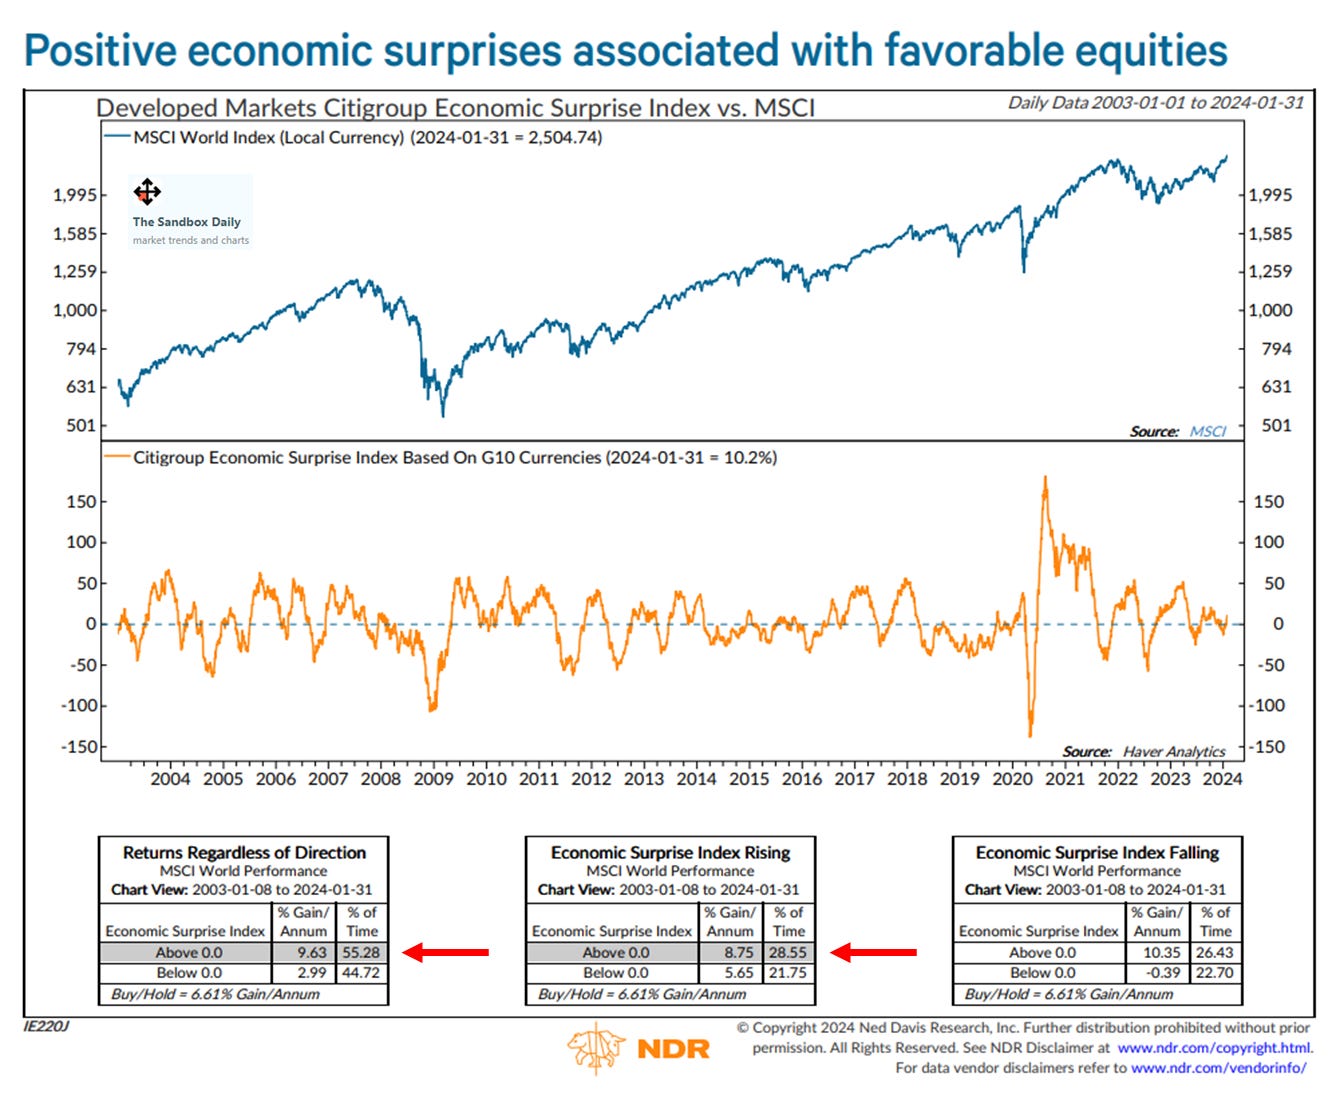
The Citigroup Economic Surprise Index, which measures economic data relative to the median expectation of professional forecasters, is one of many sentiment indicators that investors monitor. Generally, sentiment measures tell us to be contrarian when we see extremes in optimism and pessimism. However, given that the surprise indexes are contrarian by nature, positive economic surprises have typically been associated with favorable equity market performance, while negative surprises have corresponded to weaker performance.
As shown in the chart below, economic surprises among developed economies are positive, indicating that economic data in the group is on balance beating expectations. Equities have typically done well when the index has been in positive territory regardless of what direction the indicator has been heading. Conversely, the worst period for the surprise index has been when the indicator has been negative and falling.
Source: Ned Davis Research
Federal Reserve can’t overcome existing debt composition
One reason for the tightening delay in the monetary policy transmission mechanism layered across the United States economy is fixed rate debt.
89% of U.S. household debt – mortgages, student loans, and auto loans – is fixed rate, while just 11% is floating rate (credit cards, HELOCs, etc).

Source: Torsten Slok
Record U.S. oil production helps tame prices
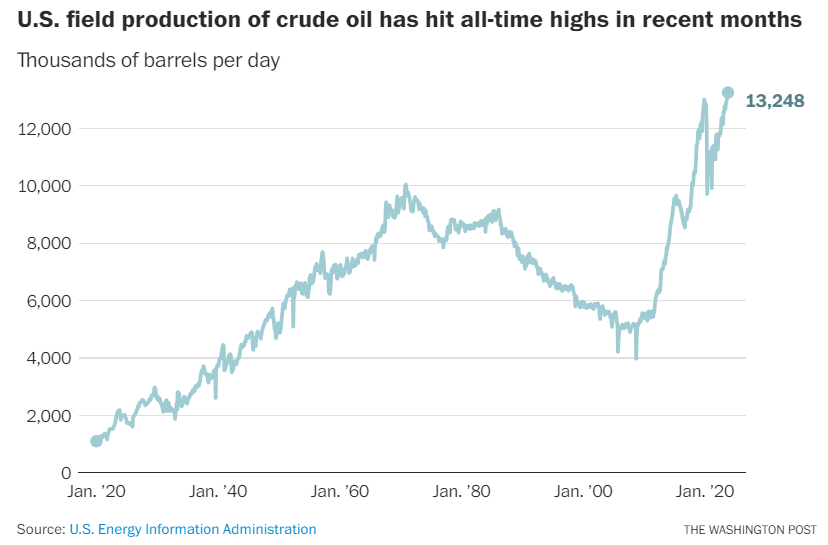
The United States is pumping oil at a record rate. That’s according to the latest data from the Energy Information Administration, which revealed that the nation’s crude oil production hit 13.2 million barrels per day, surpassing the pre-Covid peak of 13 million in late 2019.
The United States’ status as the world’s leading oil and gas behemoth has only strengthened over the last few years after relying on imported oil from around the world for decades. Domestic oil production has more than doubled since 2012 — which has made the U.S. the world's leading producer, after beating Russia for the top spot in 2018. As of 2022, the U.S. accounted for nearly 15% of the world's crude oil production, with Texas alone contributing more than 40% of that.
These production levels are helping send crude prices lower, which have been falling since the near-term peak back in September 2023.
For decades, politicians have talked about the U.S. achieving energy independence, a seemingly elusive goal of producing enough fuels to avoid relying on the rest of the world to fill up gas tanks and keep electricity flowing.
No more.
The United States has been a net exporter of crude oil and petroleum products for the last two years.

Source: The Washington Post
ETF investor data
ETF inflows hit a healthy $583 billion in 2023, in line with 2022 levels. Equity flows are stabilizing after the manic buying we saw in 2021 that preceded the market top.

Plain vanilla, index-tracking ETFs continue to take the lion’s share of assets, while active management captured market share from strategic beta and idiosyncratic strategies (think ESG, for one).

One common thread underpinning the interest in ETFs? Fees.
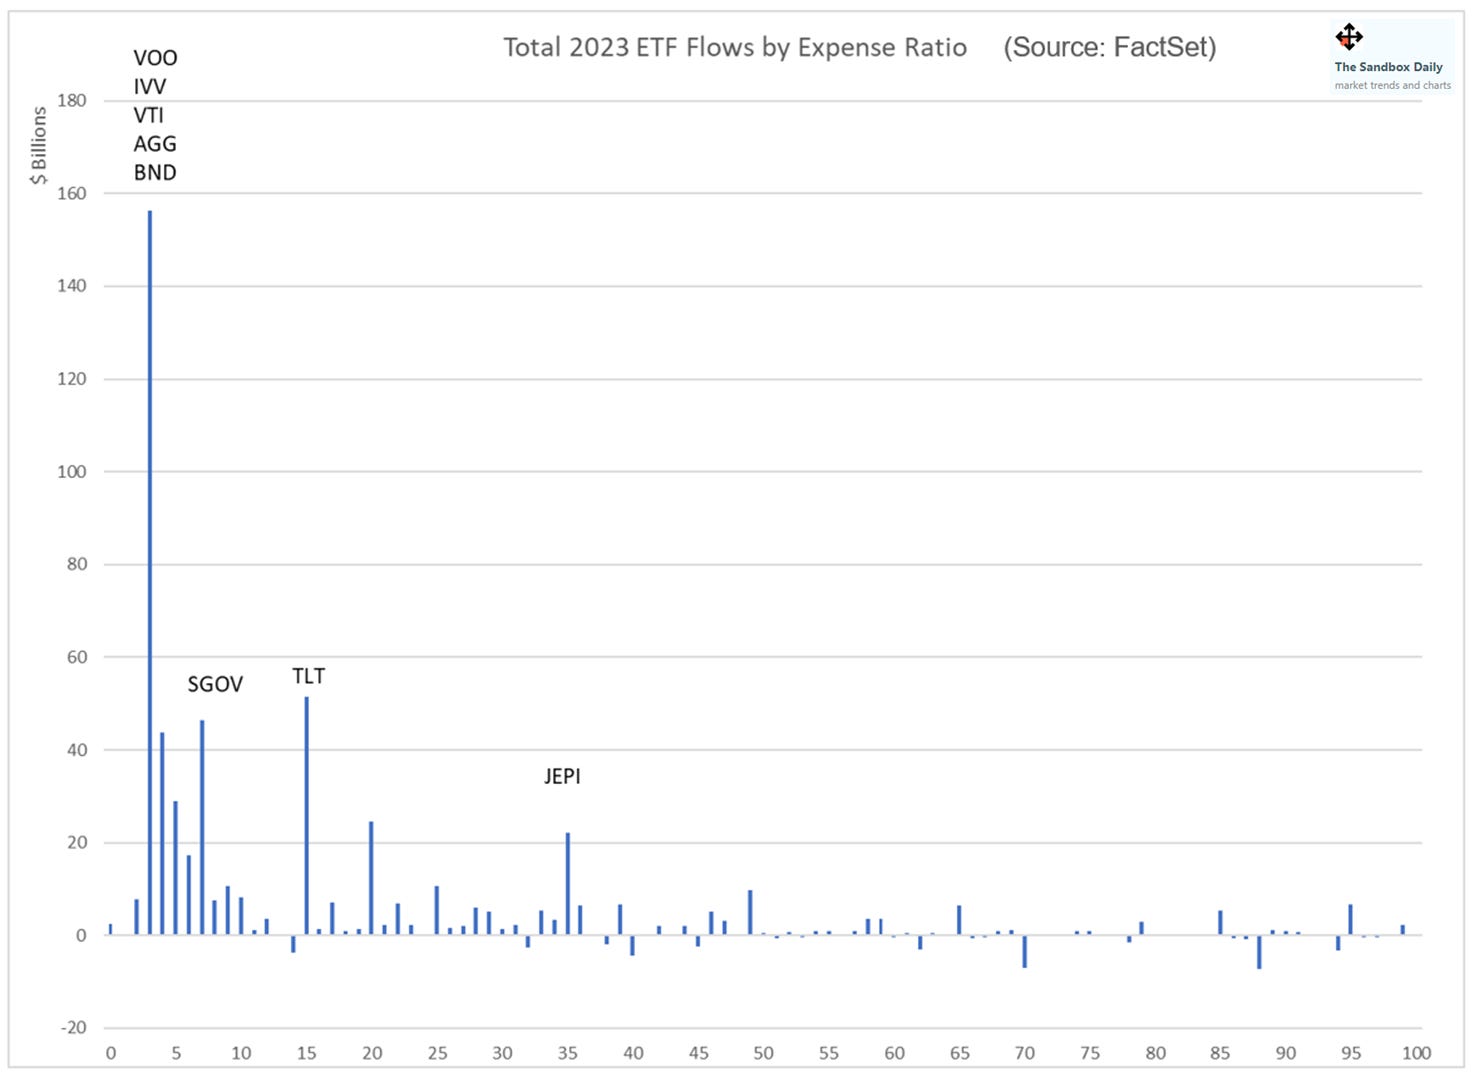
ETF investors continue to gravitate towards the cheapest funds available, where ETFs tracking the S&P 500 (VOO, IVV), the total stock market (VTI), and the Bloomberg Aggregate Bond Index (AGG, BND) cost only 0.03% per year.
Notably, 60% of that $583 billion went to ETFs that cost no more than 0.10% per year.
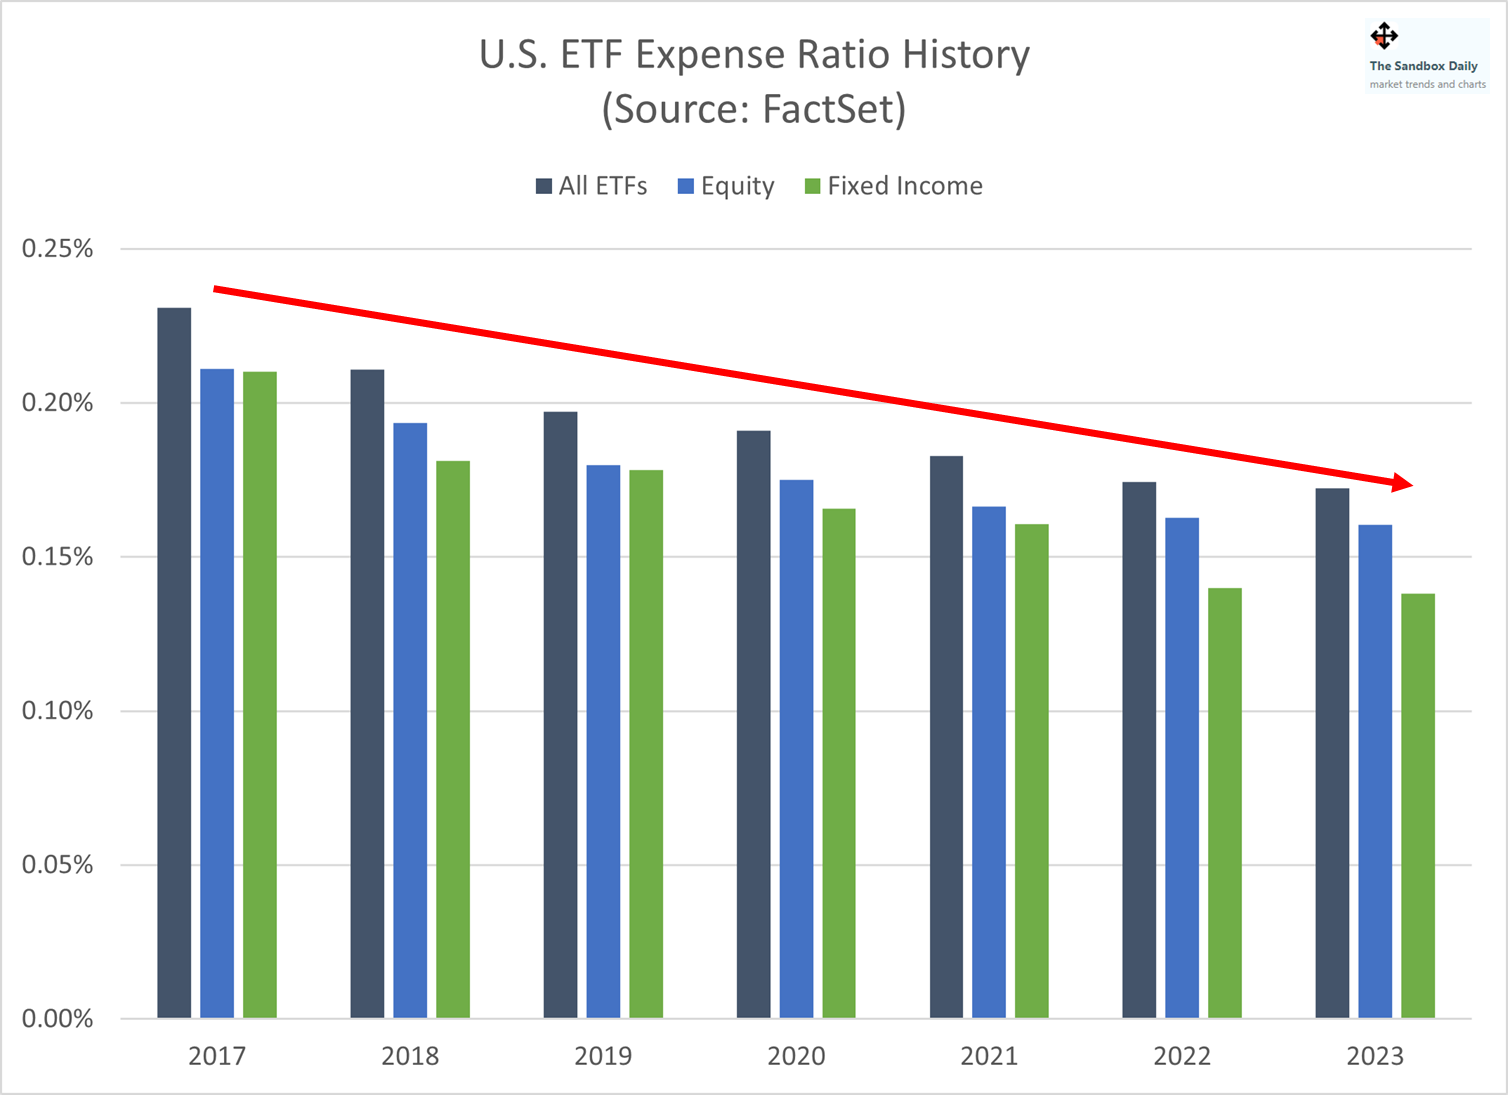
As you can see, asset-weighted expense ratios have been falling for years – in part because asset managers lower their costs proactively as a competitive edge but also as investor capital moves into the lowest-cost options available.
Source: FactSet
That’s all for today.
Blake
Welcome to The Sandbox Daily, a daily curation of relevant research at the intersection of markets, economics, and lifestyle. We are committed to delivering high-quality and timely content to help investors make sense of capital markets.
Blake Millard is the Director of Investments at Sandbox Financial Partners, a Registered Investment Advisor. All opinions expressed here are solely his opinion and do not express or reflect the opinion of Sandbox Financial Partners. This Substack channel is for informational purposes only and should not be construed as investment advice. The information and opinions provided within should not be taken as specific advice on the merits of any investment decision by the reader. Investors should conduct their own due diligence regarding the prospects of any security discussed herein based on such investors’ own review of publicly available information. Clients of Sandbox Financial Partners may maintain positions in the markets, indexes, corporations, and/or securities discussed within The Sandbox Daily. Any projections, market outlooks, or estimates stated here are forward looking statements and are inherently unreliable; they are based upon certain assumptions and should not be construed to be indicative of the actual events that will occur.