Elevated equity positioning, plus Santa Claus no-shows, lending standards vs. credit spreads, and central bank policy
The Sandbox Daily (1.4.2024)
Welcome, Sandbox friends.
Today’s Daily discusses:
investors start the year with elevated equity positions
stocks fail to stage Santa Claus rally
banks and credit investors have vastly different opinions
follow the (central bank) leader
Let’s dig in.
Markets in review
EQUITIES: Dow +0.03% | Russell 2000 -0.08% | S&P 500 -0.34% | Nasdaq 100 -0.53%
FIXED INCOME: Barclays Agg Bond -0.40% | High Yield -0.39% | 2yr UST 4.389% | 10yr UST 4.004%
COMMODITIES: Brent Crude -0.74% to $77.67/barrel. Gold +0.40% to $2,051.1/oz.
BITCOIN: +3.73% to $44,381
US DOLLAR INDEX: -0.09% to 102.405
CBOE EQUITY PUT/CALL RATIO: 0.69
VIX: +0.64% to 14.13
Quote of the day
“Investing is not entertainment – it's a responsibility – and investing is not supposed to be fun or 'interesting.' It's a continuous process, like refining petroleum or manufacturing cookies, chemicals or integrated circuits. If anything in the process is 'interesting,' it's almost surely wrong.”
- Dr. Charles Ellis in Winning the Loser’s Game
Investors start the year with elevated equity positions, at least versus 2023
As a new year begins, a natural question that often arises is how investors are positioned at the start of the year.
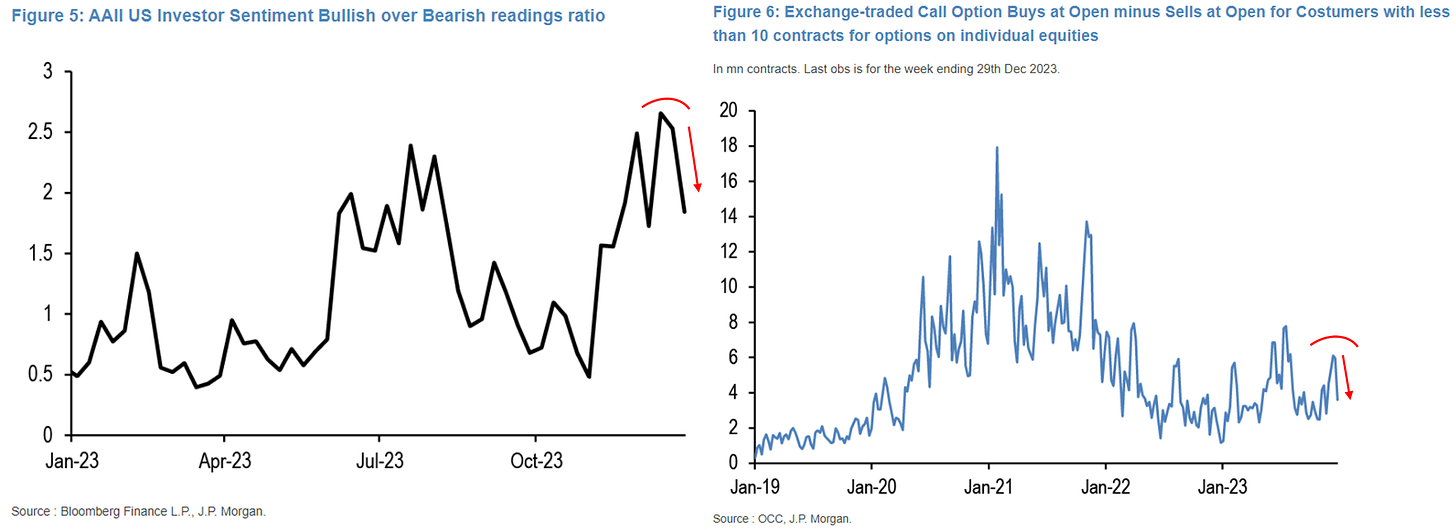
Proxies used for the retail impulse all suggest that the strong accumulation by investors into equities at the end of last year likely peaked, at least in the short term.
Recent bullishness expressed through surveys and position data show investor fatigue over the last two weeks.
Regarding large speculators, the Commitment of Traders (COT) report – a weekly publication produced by the Commodity Futures Trading Commission (CFTC) that shows the aggregate holdings of different participants in the U.S. futures market – shows that equity positions as a % of open interest on the market has risen to its highest levels since the beginning of 2022 for both asset managers and leveraged funds. This chart aggregates positions held in the S&P 500, Dow Jones, Nasdaq, and their respective mini futures contracts.
Taken together, it should be no surprise that short interest on the S&P 500 and Nasdaq 100 has consequently fallen as investors lever back up on risk and long positions.
Source: J.P. Morgan Markets, American Association of Individual Investors
Stocks fail to stage Santa Claus rally
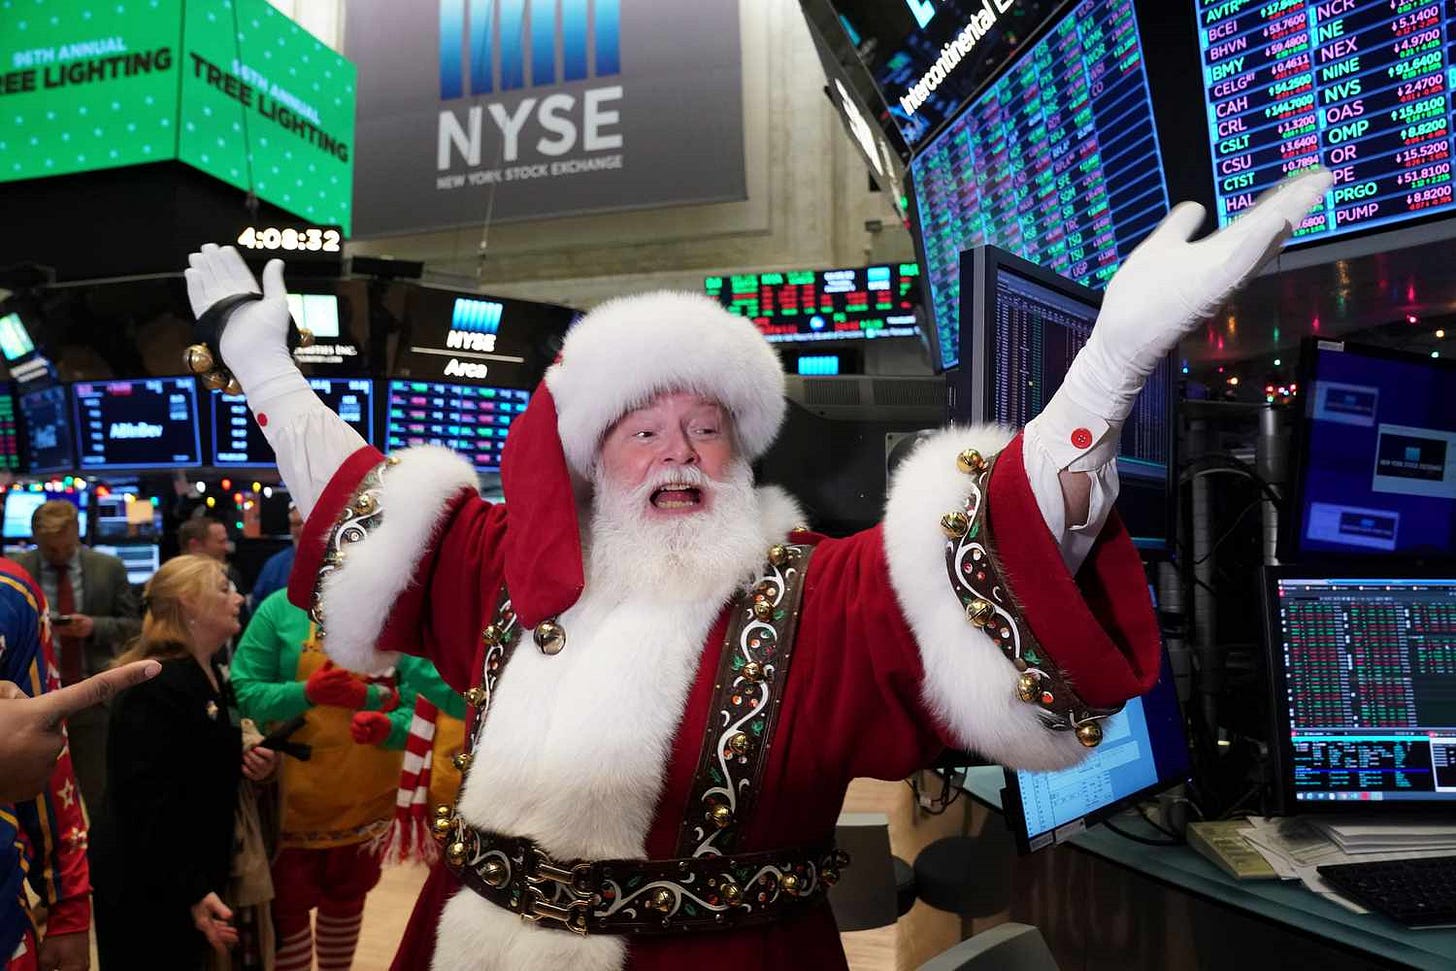
Santa Claus was pretty much a no-show on Wall Street this year.
Perhaps it’s no surprise given the outsized gains we witnessed all of November and December.
As defined by the Stock Trader’s Almanac, the “Santa Claus rally” refers to the S&P 500’s tendency to rise during the last five trading days of a calendar year and the first two trading sessions of the new year. This year, the Santa Claus Rally ran from December 22nd to January 3rd.
During the Santa Claus Rally, the S&P 500 has gained an average of +1.3% over the 7-day trading period, closing higher 79% of the time – the 3rd best 7-day period of the whole year.
This time around the S&P 500 fell -0.9%, the worst Santa-rally since 2015-2016.
This doesn’t happen often, but a poor showing from Santa does often lead to softness in January and Q1 so some caution may be warranted.
This was the first leg of the January Trifecta, which also includes "The First 5 Days" and the "January Barometer."
As the saying goes: “As January goes, so goes the rest of the year.”
Source: Ryan Detrick
Banks and credit investors have vastly different opinions
Companies primarily borrow from banks and credit investors via the corporate debt markets. Traditionally, banks and credit investors shared similar perspectives on the pricing of corporate loans and debt.
Today, however, there is a notable contrast in their current views.
The graph below compares bank lending standards to the yield premium of junk bonds versus U.S. Treasury securities.
It is evident that increases in lending standards (blue line) often precede or coincide with economic recessions. Consequently, the spreads on junk bonds (red line) widen as investors demand higher yields to compensate for escalating default risks. As the economy increasingly relies on debt, one would expect this correlation to strengthen over time. However, the percentage of banks tightening lending standards has surged, yet junk bond spreads haven't budged from historically low levels.
Why might this time be different?
Currently, banks have two predominant reasons to tighten lending standards.
First, the yield curve is inverted – remember, banks borrow at the short-term rate and lend at the long-term rate. There is less incentive to make new loans when short rates are higher than long rates. Consequently, their profit margins on new loans are lower than they typically prefer. To offset it, they can raise interest rates or refuse to lend money. Both options equate to tighter lending standards.
Second, deposits at commercial banks have shrunk by approximately $800 billion since mid-2022. Deposits provide banks with the capital to lend. As deposits flee for higher-yielding alternatives, banks are forced to reduce assets. Therefore, even if the banks are comfortable with lending risks, the inverted yield curve and loss of deposits force them to enact more conservative lending standards. Junk bond investors have no such constraints.
Source: St. Louis Fed
Follow the leader
At its December FOMC meeting, the Federal Reserve’s Dot Plot and Chair Powell’s comments alluded to rate cuts in 2024. Last month other major central banks, such as the European Central Bank (ECB) and Bank of England (BoE), also conducted their meetings but gave little indication of a pivot to rate reductions in the near-term.
With most of these major developed economies having made significant progress toward reducing inflation, the market is looking toward rate cuts some time in 2024.
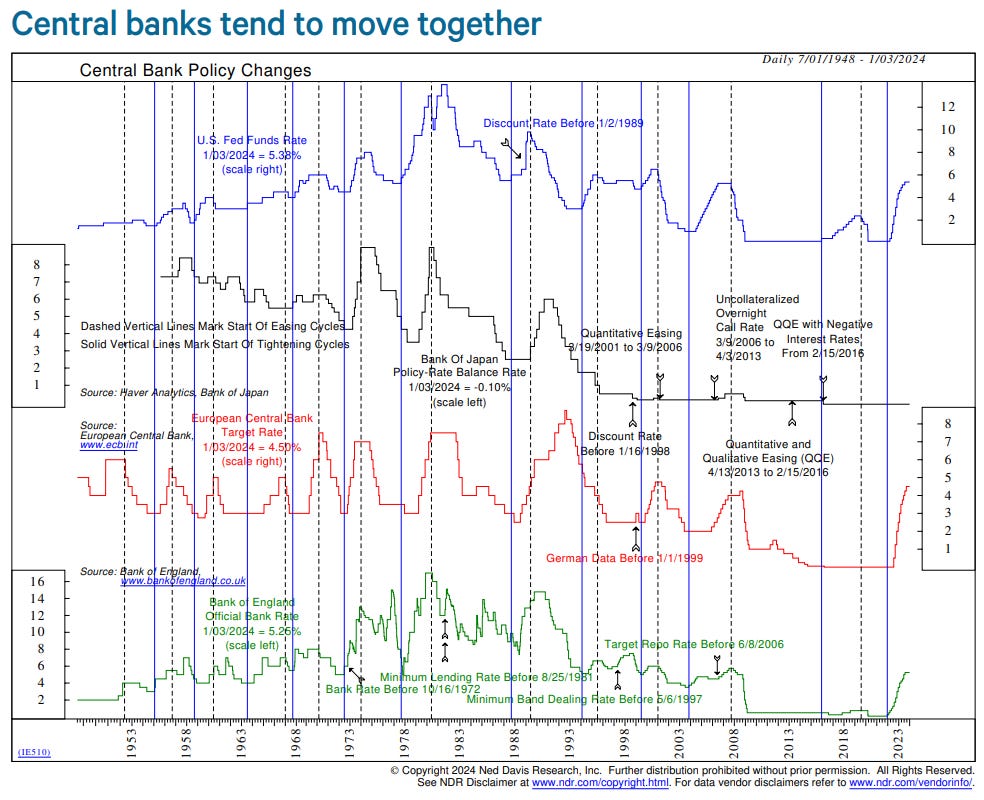
History suggests that despite working as independent entities, central banks tend to follow each other closely, reflecting the strong interrelationship of the global economy. Moreover, recent history finds that the Fed has typically started cutting rates first.
As shown in the chart below, since the 1980s the Fed has initiated almost every easing cycle among major central banks (as shown by the vertical dashed black lines). Prior to the 1980s, the leading central bank varied but more than half the time it was the BoE that began rate cut cycles.
The table below shows the instances where the Fed initiated rate cut cycles first among major central banks. This has happened in every easing cycle since the 1980s except for 1998, when the Bank of Japan (BoJ) cut rates less than a month before the Fed.
On average, the ECB and BoJ have reduced rates roughly eight months after the Fed’s first cut. The BoE has been much quicker, cutting rates an average of almost five months later.
And what of the implications for stocks?
On average, the S&P 500 index tend to be up by around the same amount a year after rate cut cycles have begun, both when the cycle was started by the Fed or another major central bank.
Please keep in mind that the range of outcomes is quite varied and the sample size is less than ideal.
Source: Ned Davis Research
That’s all for today.
Blake
Welcome to The Sandbox Daily, a daily curation of relevant research at the intersection of markets, economics, and lifestyle. We are committed to delivering high-quality and timely content to help investors make sense of capital markets.
Blake Millard is the Director of Investments at Sandbox Financial Partners, a Registered Investment Advisor. All opinions expressed here are solely his opinion and do not express or reflect the opinion of Sandbox Financial Partners. This Substack channel is for informational purposes only and should not be construed as investment advice. The information and opinions provided within should not be taken as specific advice on the merits of any investment decision by the reader. Investors should conduct their own due diligence regarding the prospects of any security discussed herein based on such investors’ own review of publicly available information. Clients of Sandbox Financial Partners may maintain positions in the markets, indexes, corporations, and/or securities discussed within The Sandbox Daily. Any projections, market outlooks, or estimates stated here are forward looking statements and are inherently unreliable; they are based upon certain assumptions and should not be construed to be indicative of the actual events that will occur.


