Falling volatility propels market higher
The Sandbox Daily (6.6.2023)
Welcome, Sandbox friends.
Today’s Daily discusses:
VIX the key to unlocking markets?
small caps follow through
yield curve inversion hits 11 months
10 simple money rules for everyone
Let’s dig in.
Markets in review
EQUITIES: Russell 2000 +2.69% | S&P 500 +0.24% | Dow +0.03% | Nasdaq 100 +0.01%
FIXED INCOME: Barclays Agg Bond +0.12% | High Yield +0.16% | 2yr UST 4.497% | 10yr UST 3.677%
COMMODITIES: Brent Crude -0.86% to $76.05/barrel. Gold +0.28% to $1,979.8/oz.
BITCOIN: +5.52% to $27,022
US DOLLAR INDEX: +0.13% to 104.136
CBOE EQUITY PUT/CALL RATIO: 0.57
VIX: -5.23% to 13.96
Quote of the day
“Diversification is about giving up on the ability to hit a grand slam so you don’t strike out at the plate.”
- Ben Carlson, A Wealth of Common Sense
VIX the key to unlocking markets?
The Volatility Index (VIX) – a gauge often referenced by investors and traders as a general expression of fear and greed in the market – closed at 13.96 today, the first close below a 14-handle since February 2020. Implied volatility has collapsed by -35% in 2023.
In other words, volatility in the stock market is now at its lowest point since the COVID-19 pandemic began. The bulls are not messing around.
And falling volatility is great news for asset prices. In fact, after a negative return year (like 2022), the median equity gain the next year is +22% (win ratio 83%, n=23) when the VIX falls, versus equity losses with a median -23% return (win ratio 14%, n=7) when the VIX continues rising.
As the scatter plot below highlights, we can see the sizable influence of the VIX. Even in “All Years,” the bifurcation in outcomes shows VIX is a key differentiating input in realized returns.
Is 2023 all about volatility?
Source: FS Insight
Small caps follow through
Stock market bulls have been looking down the cap stack to mid- and small-sized companies to pick up the pace and start participating in 2023’s rally in a more constructive way.
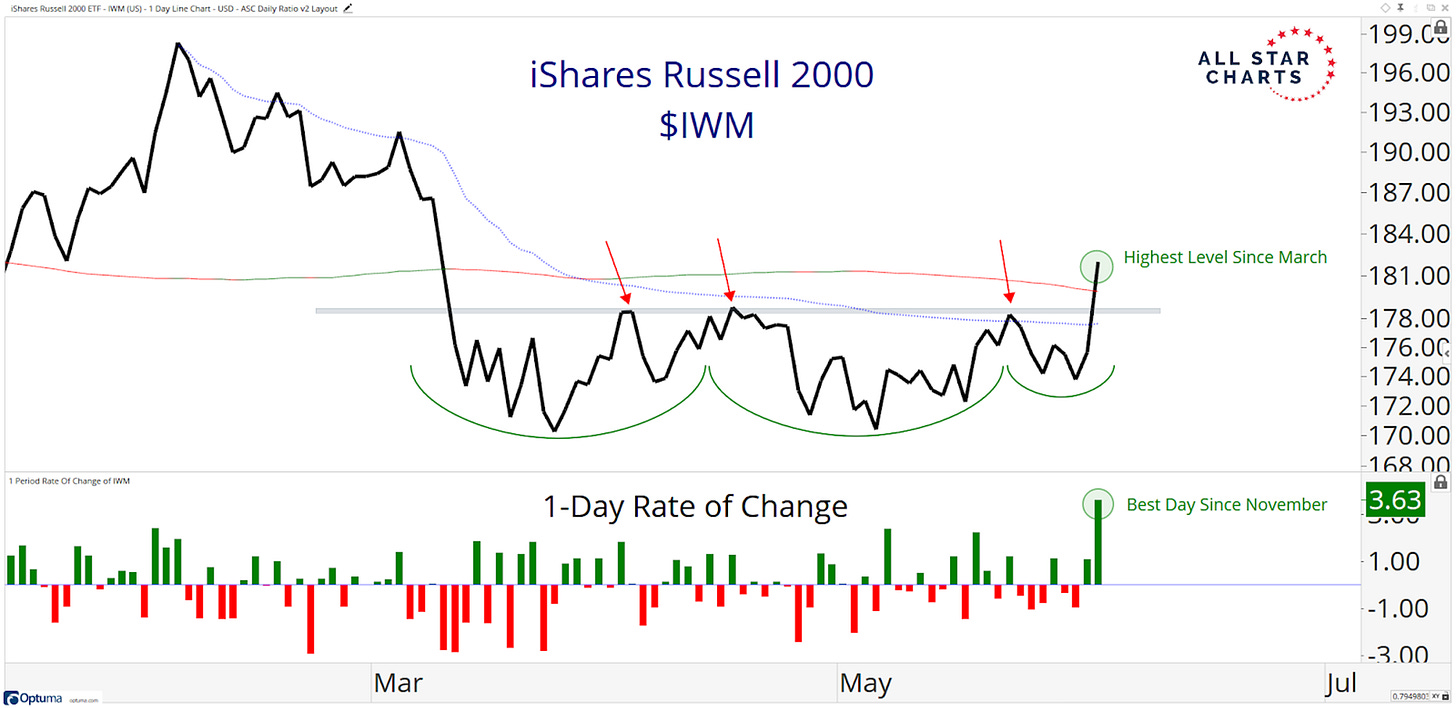
Last week, the Russell 2000 (IWM) answered those calls on Friday by registering its best single-day performance since November, closing at $182.02.
Today, the index followed through in a big way after some digestion yesterday – registering its 2nd best single-day performance since November (not shown on chart below) – closing at $184.31.
The Russell 2000 is resolving higher from this textbook head and shoulders reversal pattern established over the past few months. The index eclipsed its pivot highs from April and May (downward-pointing red arrows), then reclaimed the anchored volume-weighted average price (AVWAP) from its year-to-date highs (shown in blue), and finally, took out its 200-day moving average (green and red line).
IF these smaller companies were going to embark on a new period of relative outperformance, wouldn’t this be a logical place for that to get going?
Notice that momentum, as measured by the 14-period relative strength index (RSI), has been diverging positively, adding conviction to a potential bounce in the ratio versus its large-cap counterpart.
The market is celebrating these rotations – as big tech takes a breather these last few sessions – which is perfectly normal behavior in bull markets.
Source: All Star Charts
Yield curve inversion hits 11 months, the median lead time for recession
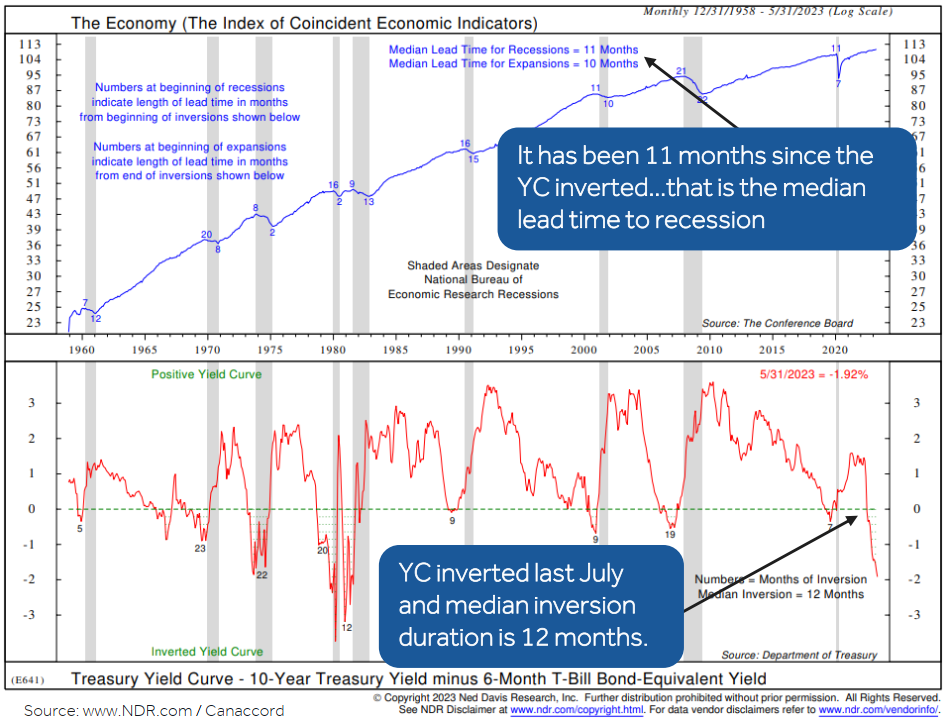
Several indicators get highlighted in financial media in which the market closely watches to gauge the risk of recession. The signal from the yield curve is one to which I always assign great value.
In particular, the 2-10 year portion of the curve has the best track record in predicting business and economic cycles. Over the past 60 years or so, the curve has inverted 9 times, and 9 recessions followed. This signal never generated a false positive.
The 2-10 Treasury curve inverted on July 6th, 2022 – so today marks 11 months since the spread between short-dated Treasury maturities (2-year) and longer-dated Treasuries (10-year) has been upside down – which is the median lead time for the indicator to flash for a recession.
This has major implications for how banks lend money – they take in deposits at the short-end and lend out at the long-end to earn a net interest margin.
Source: Dwyer Strategy
10 simple money rules for everyone
The tools for building financial wealth are simple but not easy.
These simple rules can help you get started:
Source: Ramit Sethi
That’s all for today.
Blake
Welcome to The Sandbox Daily, a daily curation of relevant research at the intersection of markets, economics, and lifestyle. We are committed to delivering high-quality and timely content to help investors make sense of capital markets.
Blake Millard is the Director of Investments at Sandbox Financial Partners, a Registered Investment Advisor. All opinions expressed here are solely his opinion and do not express or reflect the opinion of Sandbox Financial Partners. This Substack channel is for informational purposes only and should not be construed as investment advice. Clients of Sandbox Financial Partners may maintain positions in the markets, indexes, corporations, and/or securities discussed within The Sandbox Daily.


