Fed cutting cycles, plus credit spreads vs. fundamentals, new world order, unemployment, and Kenny Chesney
The Sandbox Daily (1.18.2024)
Welcome, Sandbox friends.
Today’s Daily discusses:
asset performance during Fed cutting cycles
High Yield spreads vs. credit fundamentals
a new world order
initial unemployment claims slip to historical lows
Editor’s note: The Sandbox Daily is taking a break on Friday for a family ski trip. We will return to your inbox on Monday, January 22nd. Enjoy your weekend!
Let’s dig in.
Markets in review
EQUITIES: Nasdaq 100 +1.47% | S&P 500 +0.88% | Russell 2000 +0.55% | Dow +0.54%
FIXED INCOME: Barclays Agg Bond -0.09% | High Yield +0.21% | 2yr UST 4.355% | 10yr UST 4.142%
COMMODITIES: Brent Crude +1.31% to $78.90/barrel. Gold +0.93% to $2,025.1/oz.
BITCOIN: -3.16% to $41,192
US DOLLAR INDEX: -0.04% to 103.404
CBOE EQUITY PUT/CALL RATIO: 0.69
VIX: -4.46% to 14.13
Quote of the day
“If it’s a competition between opinion and price, I will usually defer to price. Opinions get changed by prices all the time. The price isn’t always right, but the price is always the truth about where bets are being laid.”
- Josh Brown in Imagine if they actually looked at stock prices
Asset performance during Fed cutting cycles
In today’s Daily, we review historical asset performance trends before and after the 1st rate cut across different Fed cutting cycles since 1984.
While each cycle is different and the sample size is small, studying historical analogs is an important exercise to lay the foundation for how markets could behave in 2024 – given the consensus expectation that the Fed will begin to cut rates at some point this year. And, at risk of stating the obvious, it’s also important to acknowledge the reason for why the Fed is cutting – the reason, itself, matters immensely.
Goldman Sachs identified 10 cutting regimes since 1984, 4 of which were associated with recessions (1990, 2001, 2007, 2020) and 6 of which were not. Further classifiers were added to those 6 non-recessionary episodes as cutting cycles motivated by “policy normalization” (1984, 1989, 1995) or “growth scares” (1987, 1995, 1998).
The two charts below show the median performance in the 1 year before and 2 years following the 1st Fed rate cut, indexed to the day of the cut itself.
The S&P 500 is shown below on the left (exhibit 2), the 2-year Treasury yield on the right (exhibit 3).
With respect to the S&P 500, stocks tend to gain strength heading into the 1st cut (based on forward expectations of the forthcoming policy shift) and rally further after the Fed actually starts to cut. Equities tend to rise following the 1st Fed cut in non-recessionary cutting cycles, while in contrast, stocks tend to decline even after the Fed begins cutting when the rate cuts are motivated by recession.
Meanwhile, yields decline in anticipation of and after that 1st cut. The decline in yields is somewhat limited in non-recessionary cutting cycles, while more pronounced during recessions.
From this exercise, it becomes clear that forward returns will largely hinge on whether the economy enters a recession (hard landing) or avoids one (soft landing).
Below is the raw data itself for 1-year forward returns after the 1st cut:
Source: Goldman Sachs Global Investment Research
High Yield spreads vs. credit fundamentals
Corporate bond spreads, which is the yield in excess to U.S. Treasuries required to compensate for credit risk among other things, continue to remain historically tight and show no concern for imminent credit losses.
The graph below illustrates the yield premium on BB-rated High Yield credit borrowers, sitting around its lowest levels over the last 25 years.
This is puzzling to many – who expect the spread to be much higher – given elevated interest rates and the fact that most junk-rated companies are highly indebted. Said differently, it should be better reflective of fundamentals. Add in the possibility of a recession that many have called for and the yield spreads are even more confounding.
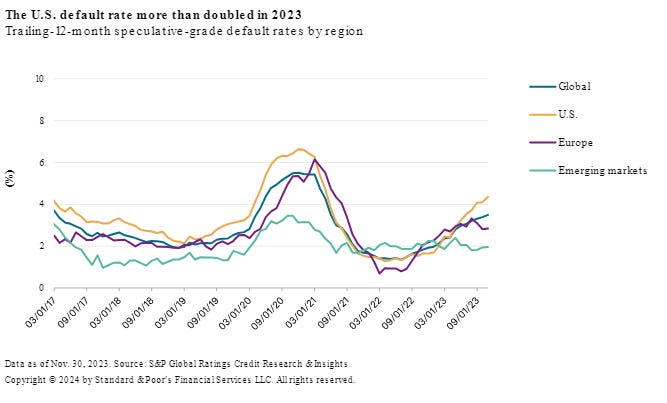
S&P Global Intelligence touched on this strange divergence in their recent credit review and outlook.
They note that corporate defaults jumped 80% in 2023, up to 153 from 85 defaults in 2022. Among last year’s casualties: Silicon Valley Bank, AMC, Lending Tree, and Bed Bath & Beyond.
Regarding S&P Global’s 2024 credit outlook:
"Expect further credit deterioration globally, predominantly at the lower end of the rating scale (rated 'B-' or below), where close to 40% of issuers are at risk of downgrades. We expect financing costs to remain elevated despite the prospect of rate cuts. And while borrowers have reduced their 2024 maturities, a large share of speculative-grade debt is expected to mature in 2025 and 2026. We think slower economic growth and higher financing costs will contribute to increasing default rates."
Further in the report, S&P Global expect default rates to reach 5% by September. Throw in a recession and the default rate would be even higher – likely causing corporate yield spreads to wake up.
Source: S&P Global Intelligence
A new world order
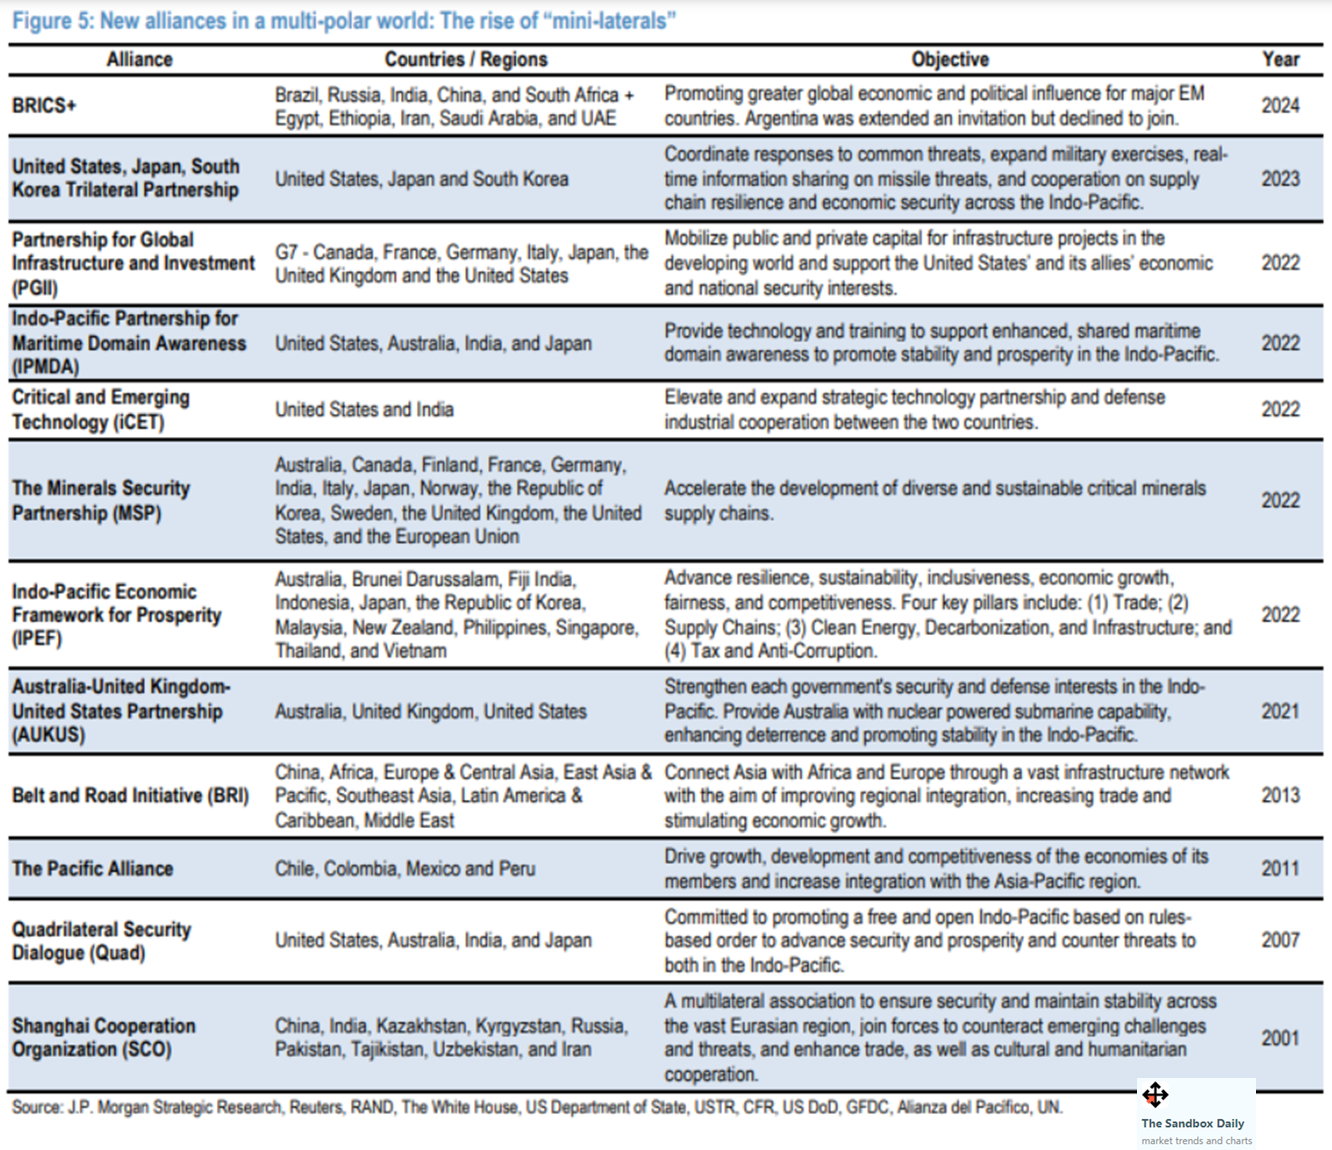
The global backdrop lay witness to unfortunate yet accelerating geoeconomic fragmentation, as sovereign diplomacy and trading patterns have shifted over the past several years with new alliances and regional blocs emerging.
The rule-based order continues to fray as the global economy evolves toward a less cooperative and more competitive multipolarity.
To be clear, we are still far from a fully fragmented world, but global alliances are unquestionably shifting.
J.P. Morgan highlights the growing proliferation of “nimble new mini-laterals:”
Further, it has been 5 or 6 decades since the global landscape has been confronted with active wars in Europe and in the Middle East, along with elevated military tensions in Asia.
The number of armed conflicts in the world has been steadily rising over the past 10 years, alongside the increase in deaths from armed conflicts, fueling the increase in financial sanctions.
Perhaps most jarring is the heightened focus of sovereign protectionism and deterioration of global diplomatic relations, leading to a steady increase in sanctioned countries around the world.
Perhaps everyone just needs to sit back, crack open a beer, and listen to Kenny Chesney’s classic hit “Get Along.”
Source: J.P. Morgan Markets
Initial unemployment claims slip to historical lows
Initial claims for unemployment insurance declined by 16,000 last week to 187,000, well below the consensus of 208,000. This was their lowest level since September 2022 and the 2nd lowest figure dating back to 1969.
The 4-week average dipped down again to ~203k, indicating a continued downtrend and at the lowest level in nearly a year. It remains low by historical norms.
Continuing jobless claims in the previous week fell 26,000 to 1.806 million, the fewest since October.
The labor market continues to showcase its remarkable strength, consistent with continued economic expansion and strong labor demand, pushing against market expectations of Fed rate cuts as early as March.
Source: Piper Sandler, Bloomberg
That’s all for today.
Blake
Welcome to The Sandbox Daily, a daily curation of relevant research at the intersection of markets, economics, and lifestyle. We are committed to delivering high-quality and timely content to help investors make sense of capital markets.
Blake Millard is the Director of Investments at Sandbox Financial Partners, a Registered Investment Advisor. All opinions expressed here are solely his opinion and do not express or reflect the opinion of Sandbox Financial Partners. This Substack channel is for informational purposes only and should not be construed as investment advice. The information and opinions provided within should not be taken as specific advice on the merits of any investment decision by the reader. Investors should conduct their own due diligence regarding the prospects of any security discussed herein based on such investors’ own review of publicly available information. Clients of Sandbox Financial Partners may maintain positions in the markets, indexes, corporations, and/or securities discussed within The Sandbox Daily. Any projections, market outlooks, or estimates stated here are forward looking statements and are inherently unreliable; they are based upon certain assumptions and should not be construed to be indicative of the actual events that will occur.


one of your best yet - great read