Fed hikes target rate, plus S&P 500 after the last hike, tighter credit conditions, performance by market cap, and oil
The Sandbox Daily (5.3.2023)
Welcome, Sandbox friends.
Today’s Daily discusses:
Fed raises target interest rate
S&P 500 performance following the end of Fed hiking cycles
tightening of financial conditions
since regional banking crisis, size matters
oil going nowhere, slowly
Let’s dig in.
Markets in review
EQUITIES: Russell 2000 +0.41% | Nasdaq 100 -0.64% | S&P 500 -0.70% | Dow -0.80%
FIXED INCOME: Barclays Agg Bond +0.44% | High Yield -0.05% | 2yr UST 3.864% | 10yr UST 3.364%
COMMODITIES: Brent Crude -4.47% to $71.95/barrel. Gold +1.26% to $2,048.8/oz.
BITCOIN: -0.32% to $28,642
US DOLLAR INDEX: -0.64% to 101.302
CBOE EQUITY PUT/CALL RATIO: 0.78
VIX: +3.15% to 18.34
Quote of the day
“Beware of overconcern for money, or position, or glory. Someday you will meet a man who cares for none of these things. Then you will know how poor you are.”
- Rudyard Kipling
Fed raises target interest rate
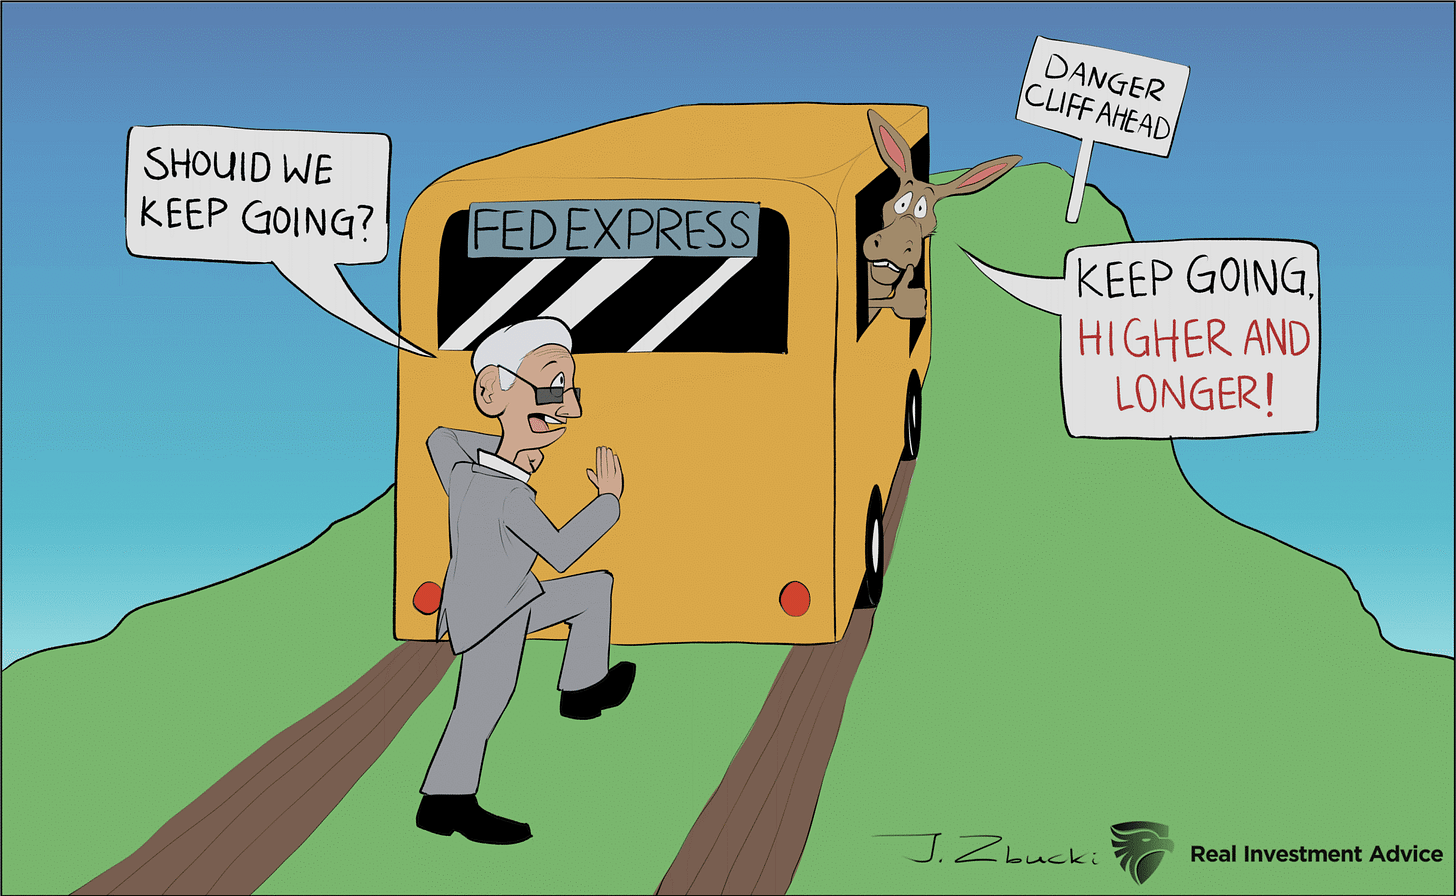
At this point, it appears inflation trumps market (in)stability in the eyes of the FOMC.
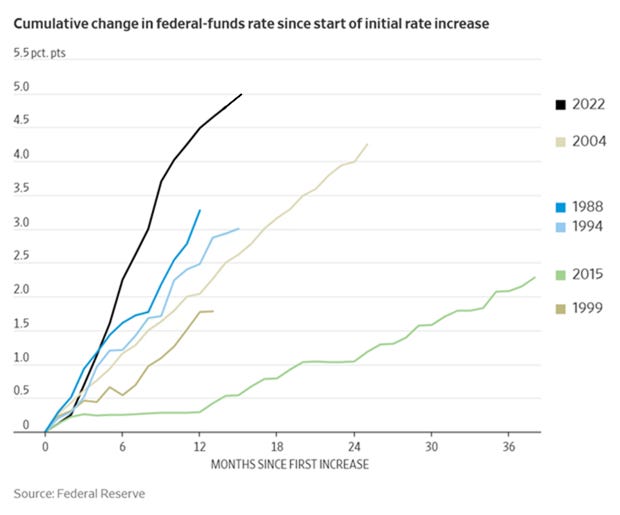
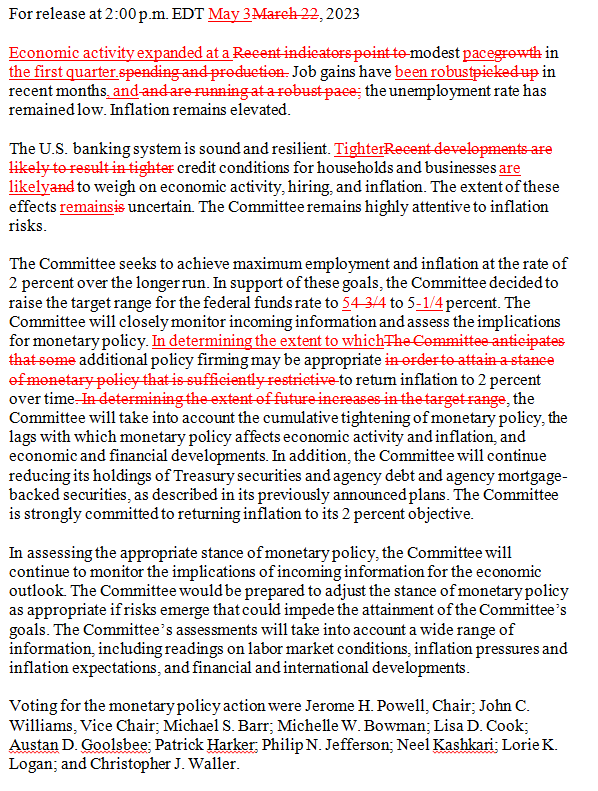
Fed policymakers concluded their two-day policy meeting today, deciding unanimously to hike its benchmark Federal Funds Rate by 25bps (0.25%). This adjustment to monetary policy takes the target range to 5.00 – 5.25%, a significantly different paradigm than early 2022 (0.00 – 0.25%). This is the 10th straight meeting of rate hikes that started March 16th, 2022 and brings the key lending rate to a 16-year high.
Over the past 14 months, the Fed has raised interest rates by a cumulative 500bps – its fastest tightening cycle in over four decades – in an effort to curb soaring inflation as the economy recovered from the pandemic.
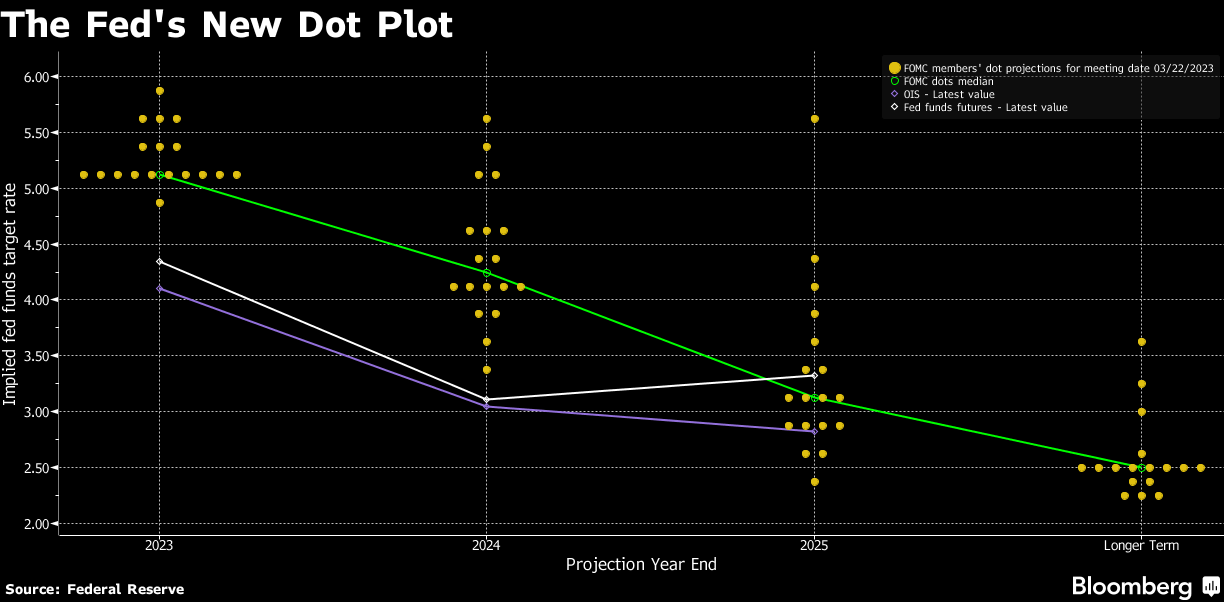
The most recent Dot Plot – the future rate projections from each FOMC participant – shows a 5.1% median estimate of the Fed Funds Rate for 2023 year-end, as outlined in the Summary of Economic Projections from March.
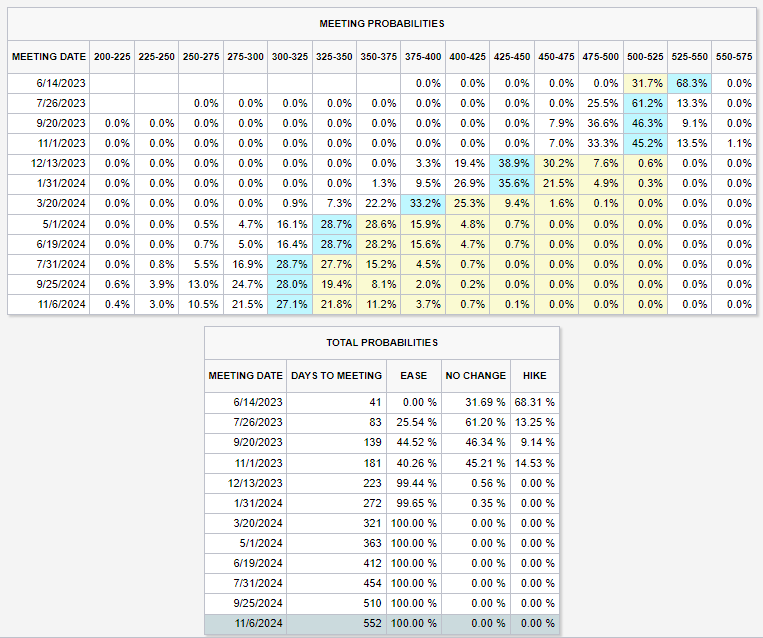
Of greater significance is that no FOMC member is projecting a rate cut in 2023, which stands in stark contrast to what the market is expecting – 1 or more rate cuts in the back half of the year. The Fed and the bond market are definitely at odds with one another.
One major statement was modified in the FOMC’s forward guidance, a softer and more dovish adjustment in the committee’s tone that hints at a pause:
New: “The committee anticipates that some additional policy firming may be appropriate”
Old: “In determining the extent to which additional policy firming may be appropriate”
The Fed may be on the cusp of hiking rates too far, too quickly – as evidenced by the volatility in Treasuries and problems plaguing the bank system – all while the debt ceiling issue lingers in the background. While the economy continues to hum along, the central bank faces a dilemma in the coming weeks and months as it attempts to simultaneously deal with the banking sector turmoil and inflation that continues to run well above its 2% target (although showing many signs of cooling).
The FOMC meets again in six weeks on June 14th. Expect a pause.
Source: Federal Reserve, FOMC Summary of Economic Projections, Investopedia, Bloomberg, Nick Timiraos, Wall Street Journal, Ned Davis Research
S&P 500 performance following the end of Fed hiking cycles
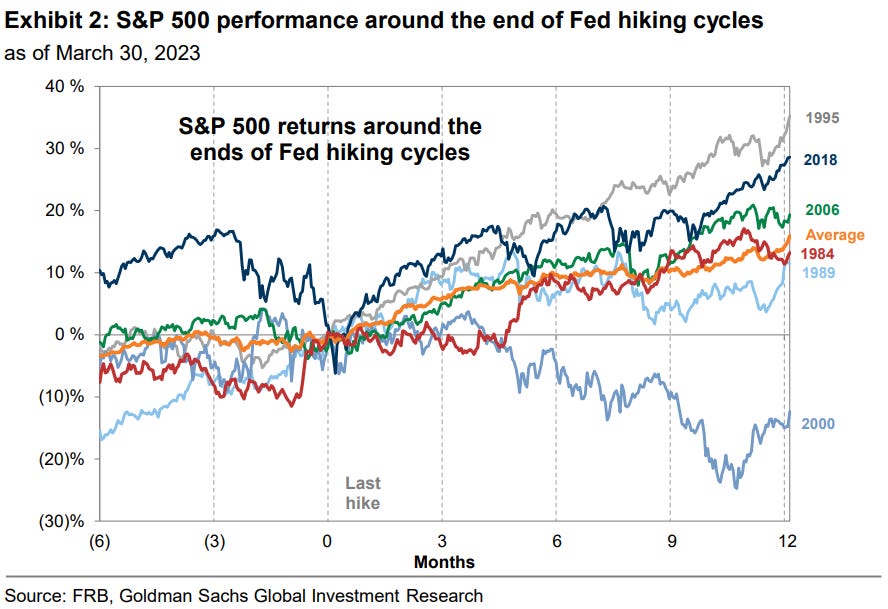
If this is the final rate hike of the cycle, U.S. equities have generally rallied in the months following the end of past Fed tightening cycles. Here’s a look at the last 6 Fed hiking cycles:
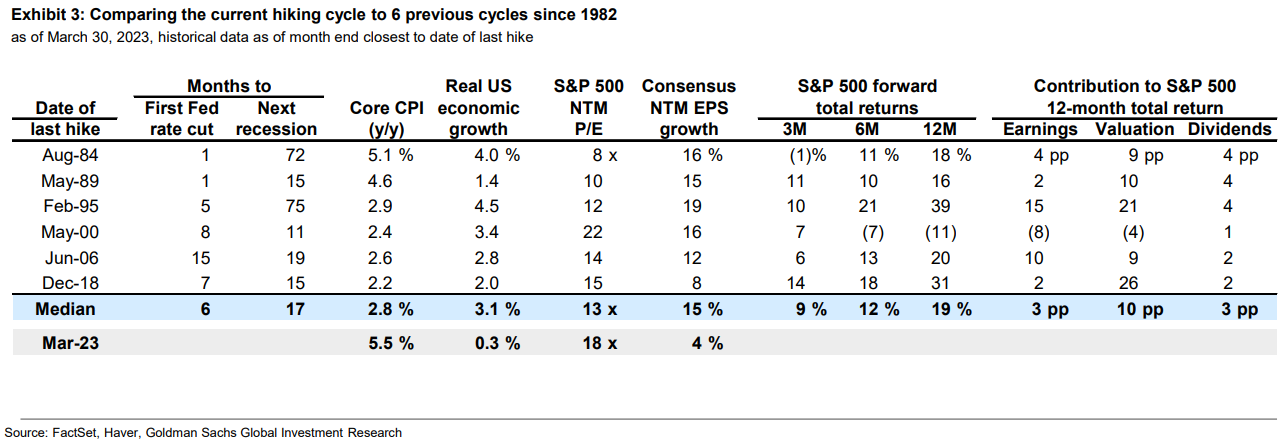
In the 3 months following the peak Fed Funds Rate, the S&P 500 has returned an average of +9%, ranging from +14% to -1% and rising in 5 of 6 episodes. On a 12-month basis, the S&P 500 has returned an average of 19%, rising in 5 of 6 episodes and rallying by more than 10% in each of those.
Post-pause rallies tend to rely on two fundamental drivers: a rally in Treasuries (which inflates price-earnings multiples) and the assumption that earnings are still expanding. Both of these metrics will be worth monitoring closely going forward.
However, equities performed poorly when the economy entered recession near the end of tightening cycles. In most instances, months passed between the end of Fed tightening, the start of easing, and the start of recession. The instances when a recession occurred within 12 months of the end of the tightening cycle (for example, the recessions of 1973, 1981, and 2001) were also the instances when the S&P 500 performed poorly.
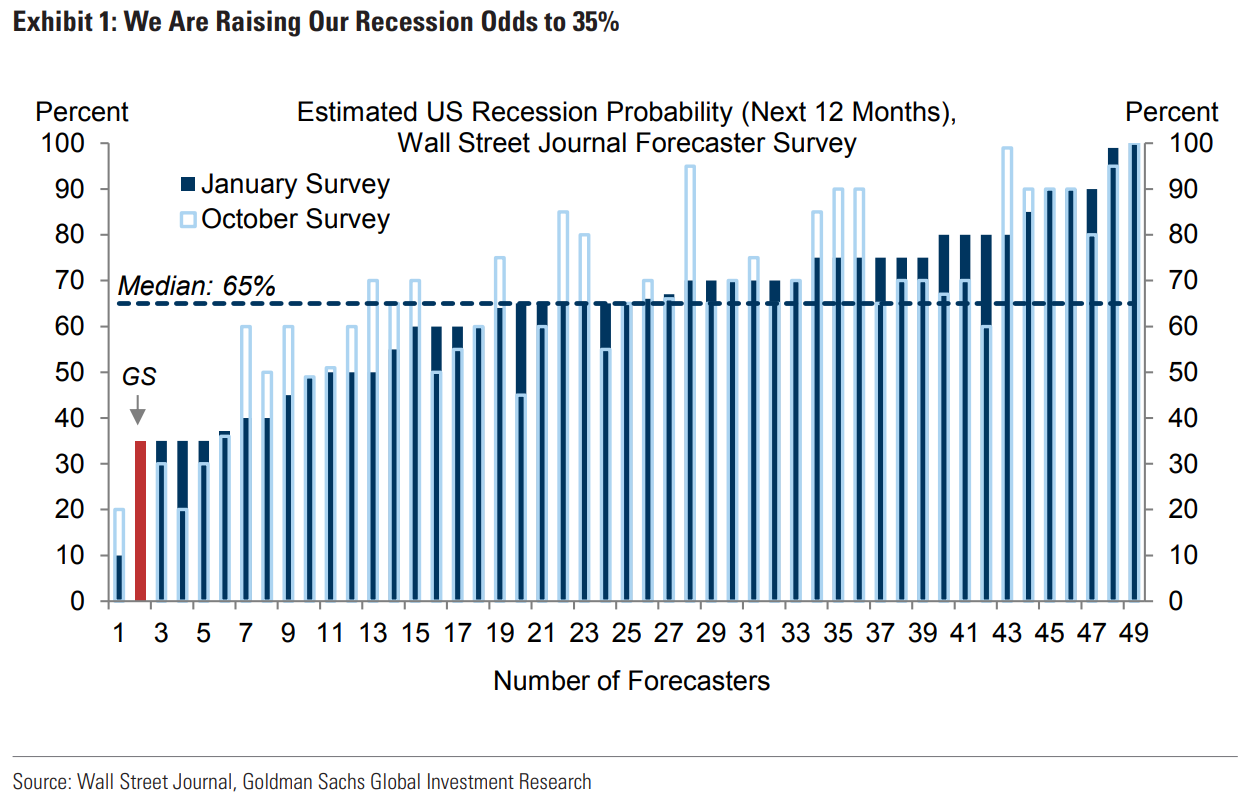
As a reminder, the median consensus estimate by economists calling for a recession in the next 12 months is roughly 65%.
Source: Goldman Sachs Global Investment Research
Tightening of financial conditions
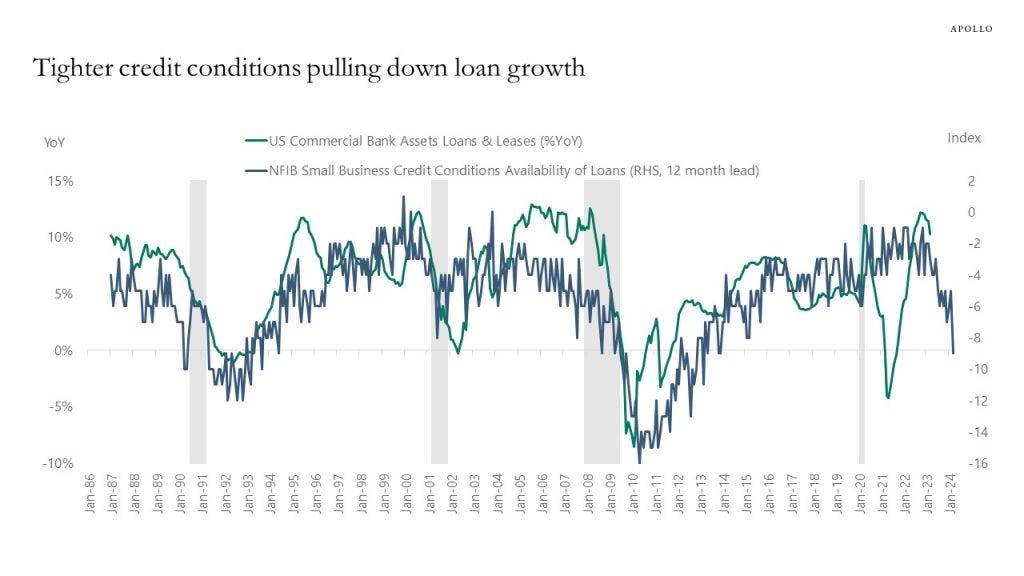
Small businesses are reporting it is harder to get a loan, and that normally means lower bank lending growth over the following 12 months.
Source: Apollo Global Management
Size matters
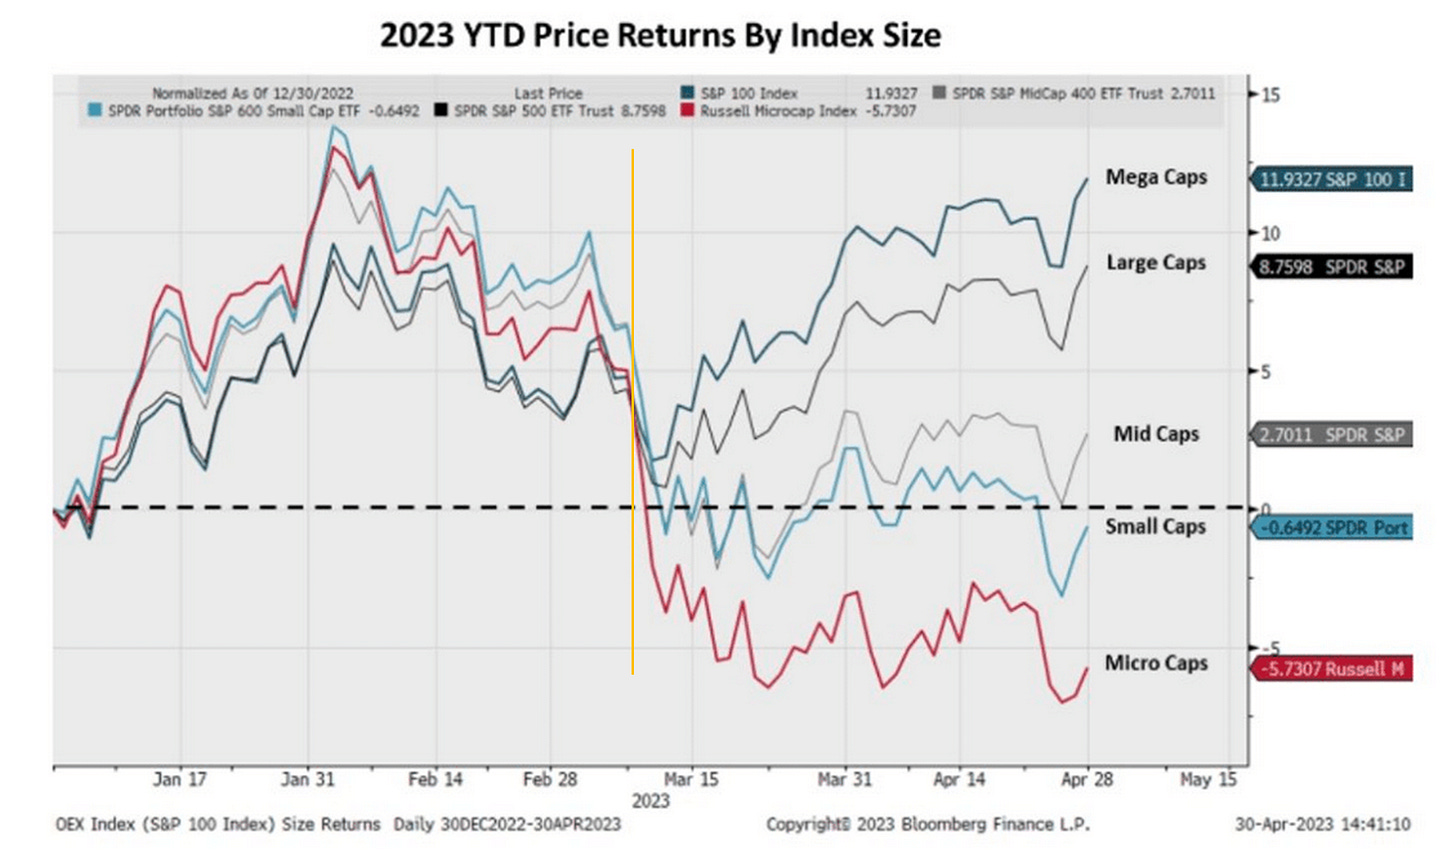
Since the regional banking crisis emerged in early-to-mid March, only one stock factor has mattered for performance: size. The chart below shows investors began to play favorites based on size (market cap) once the stress among small- and mid-sized banks started crossing the newswires.
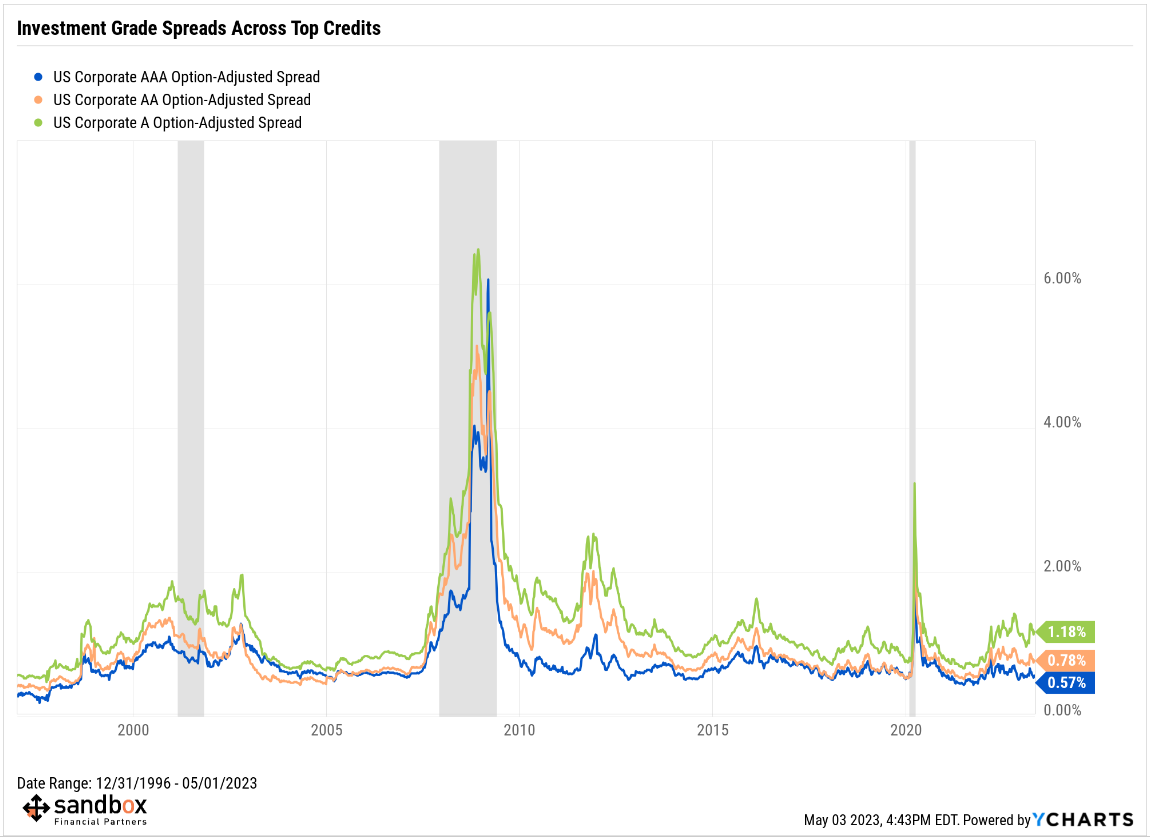
What the market seems to imply is that larger companies will not be affected by the tighter lending standards that are sure to accompany the banking crisis. Most large-cap companies have access to credit via the bond market and can largely avoid relying on banks. This is reflected in the corporate bond market where investment grade spreads are showing no alarming signs of stress, yet.
One risk to monitor here are the small businesses who employ 61.7 million workers, or roughly half our labor force. Many small companies rely heavily on working capital balances and revolving loans from regional banks, as we were reminded during the Silicon Valley Bank episode before the Fed backstopped their deposits. If said loans are more costly or harder to obtain, layoffs and bankruptcies will follow.
Source: Forbes, Lance Roberts
Oil going nowhere, slowly
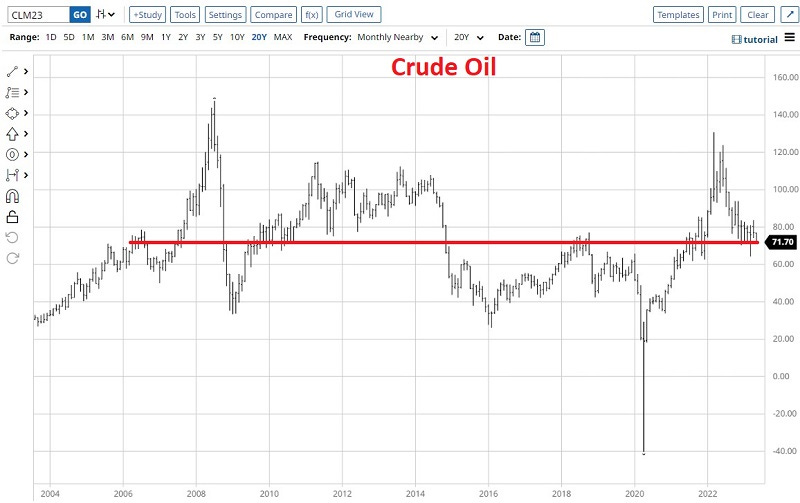
Oil has been on a violent slide since the recent top of $83.09 on April 12th, breaking down this week below a key $72-$73 support level that was defended in September and December 2022, as well as January and February 2023.
Oil is now trading at the same price it did in 2005, 2006, 2007, 2008, 2009, 2010, 2014, 2018, and 2021.
It’s disappointing that Energy has ignored the traditionally bullish seasonality that normally occurs in April and May. The market is looking for oil to show evidence of stabilization and hold above the March 2023 lows.
Source: SentimenTrader
That’s all for today.
Blake
Welcome to The Sandbox Daily, a daily curation of relevant research at the intersection of markets, economics, and lifestyle. We are committed to delivering high-quality and timely content to help investors make sense of capital markets.
Blake Millard is the Director of Investments at Sandbox Financial Partners, a Registered Investment Advisor. All opinions expressed here are solely his opinion and do not express or reflect the opinion of Sandbox Financial Partners. This Substack channel is for informational purposes only and should not be construed as investment advice. Clients of Sandbox Financial Partners may maintain positions in the markets, indexes, corporations, and/or securities discussed within The Sandbox Daily.


