

Fed's preferred inflation measure, plus stocks up Q1, seasonality, black swans, and the week in review
The Sandbox Daily (3.31.2023)

Welcome, Sandbox friends.
Today’s Daily discusses:
the Fed’s preferred inflation measure
quarterly candles
seasonality favors stocks in April
black swans
a brief recap to snapshot the week in markets
Let’s dig in.
Markets in review
EQUITIES: Russell 2000 +1.93% | Nasdaq 100 +1.68% | S&P 500 +1.44% | Dow +1.26%
FIXED INCOME: Barclays Agg Bond +0.48% | High Yield +1.08% | 2yr UST 4.038% | 10yr UST 3.473%
COMMODITIES: Brent Crude +0.63% to $79.74/barrel. Gold -0.55% to $1,986.8/oz.
BITCOIN: +0.94% to $28,393
US DOLLAR INDEX: +0.44% to 102.598
CBOE EQUITY PUT/CALL RATIO: 0.66
VIX: -1.68% to 18.70
Quote of the day
“The public is often right during the trends, but wrong at both ends.”
-Humphrey B. Neil
Fed’s preferred inflation measure eases in February
This morning’s BLS report on the Personal Consumption Expenditures (PCE) price index – which the Federal Reserve uses for its inflation projections – showed that inflation eased somewhat in February but underlying pressures continue to run hot – keeping the Fed on track for another rate hike in May.
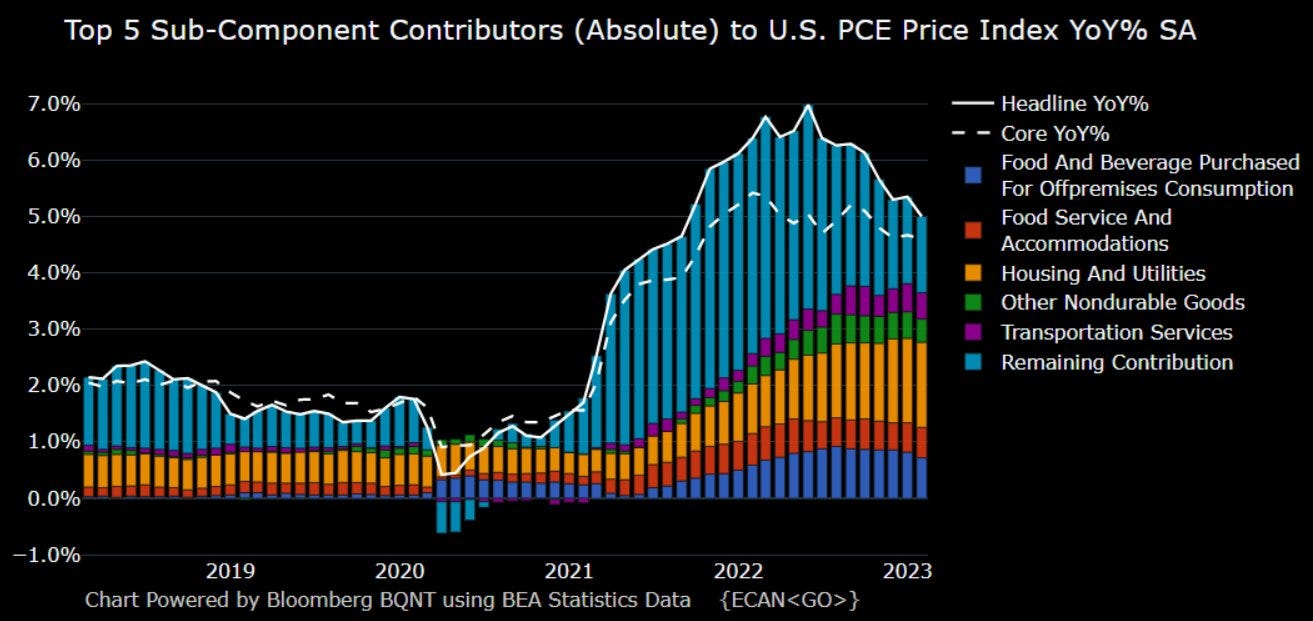
Both headline and core Personal Consumption Expenditures (PCE) rose by +0.3% in February, each down from +0.6% January.
On a year-over-year basis, the headline PCE measure eased to +5.0% while core PCE ticked down to +4.6%.
The Fed’s target is 2%.
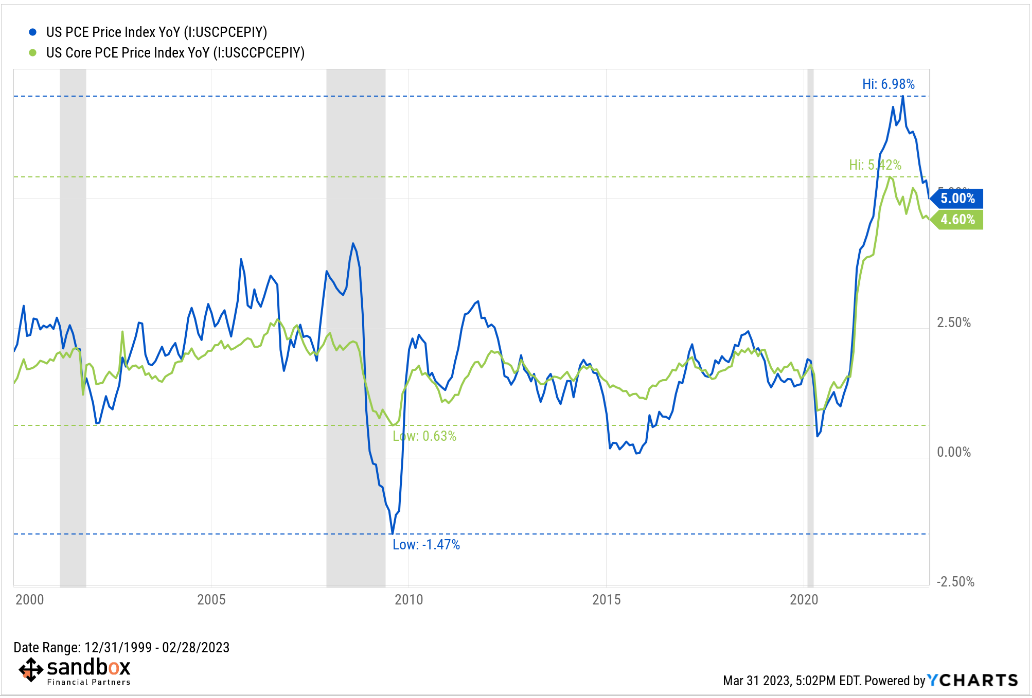
Fed Chairman Jerome Powell has repeated numerous times in recent months that he is looking for a decline in super-core inflation for confirmation that underlying inflation pressures are moving in the right direction. Lacking such confirmation, it’s likely the Fed will not cut its inflation fight short, particularly since the Fed’s new bank lending facility, discount window borrowing, and FDIC deposit guarantees at the banks that failed earlier this month have seemingly halted the bank liquidity crisis. Most are expecting one more rate hike in May before the Fed pauses to assess the cumulative impact of tightening on inflation, the economy, and financial stability.
Source: Bureau of Labor Statistics, Ned Davis Research, Bloomberg
Quarterly candles
With March now behind us, another quarter is in the books. While it may not have felt like it, U.S. and international stocks just posted their second consecutive quarter of gains.
Stocks all around the world have been moving steadily higher since the lows from last fall. Here is a long-term quarterly candlestick chart of the S&P 500:
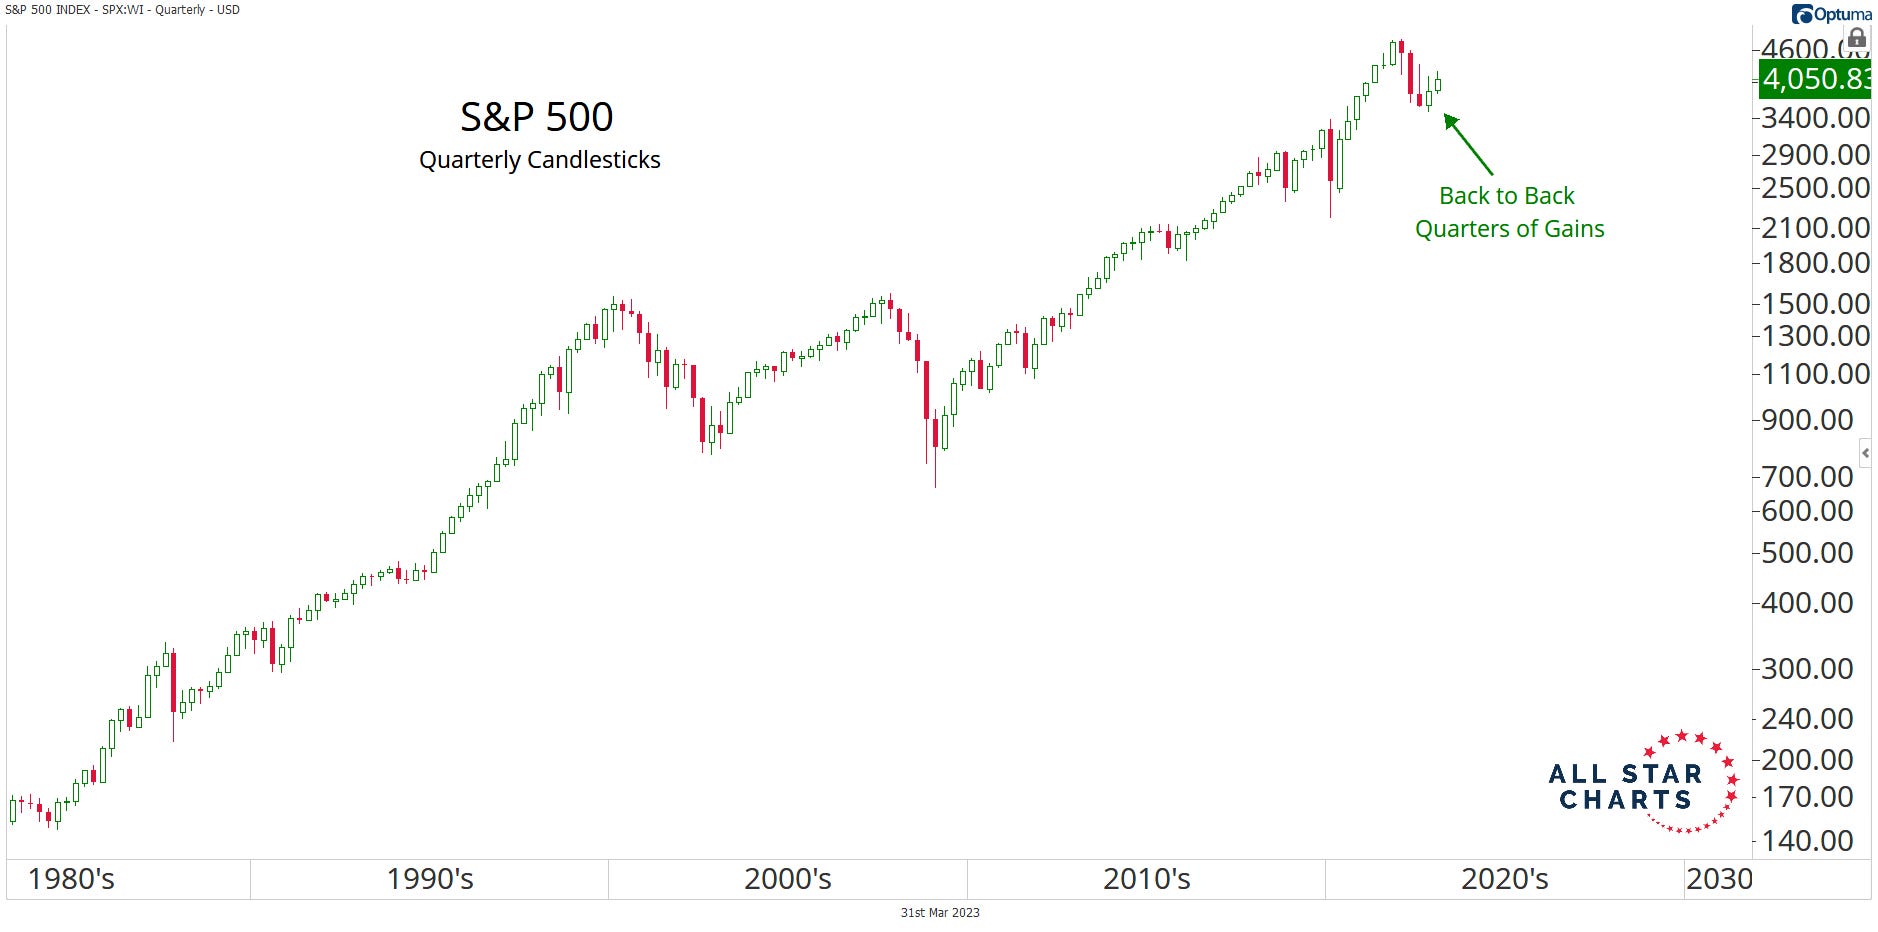
The first three quarters of 2022 were negative, representing the longest streak of quarterly losses since the global financial crisis in 2008 and 2009. However, the selling pressure could be behind us for now, as bulls have been back in control since late last year.
With stocks entering a seasonally strong period (more on that in the section below), more gains could be in store.
Source: All Star Charts
Seasonality favors stocks in April
April is the second best month of the year for the stock market since 1950 (yellow bars below); only November is better.
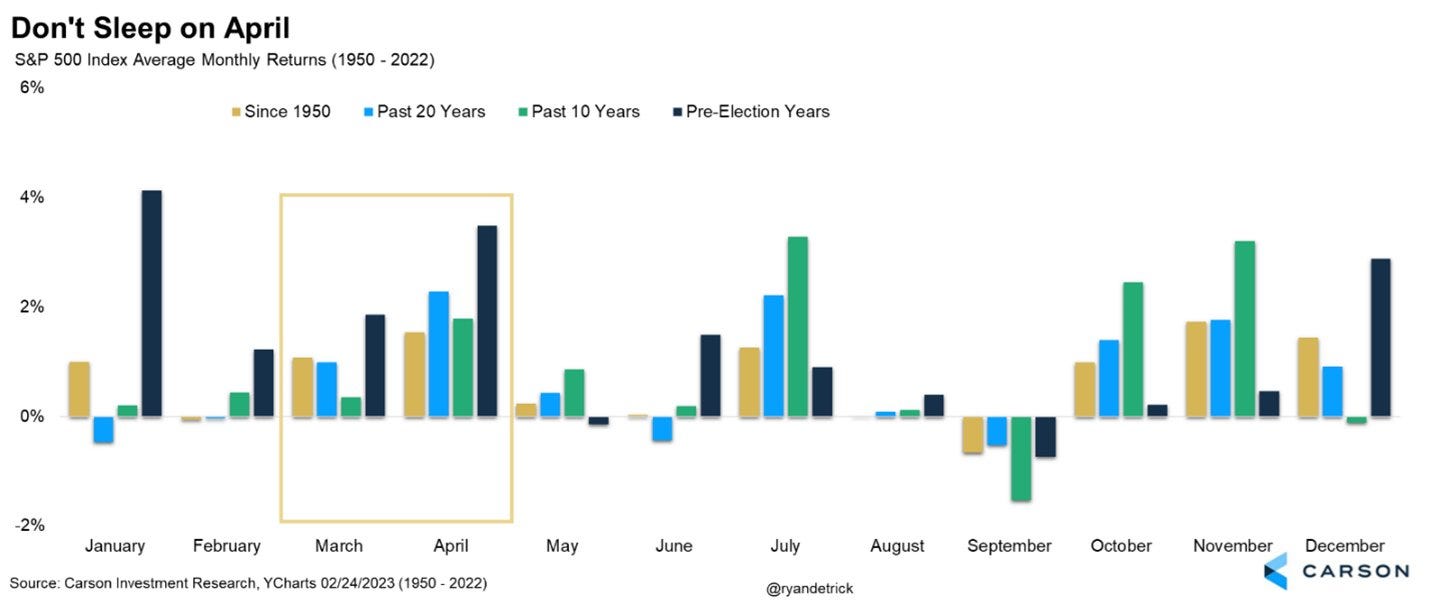
The S&P 500 has been up 17 of the last 18 times in a pre-election year. And over the last 20 years, April has been the best performing month.
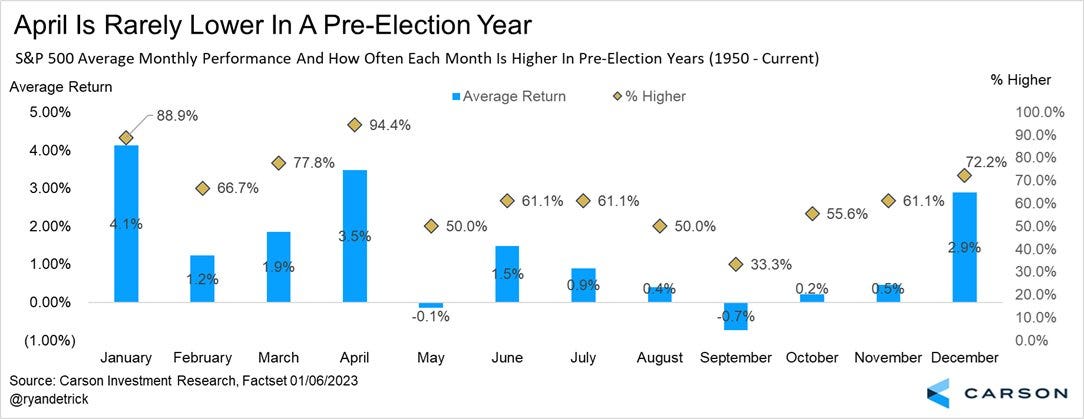
Source: Ryan Detrick
Black swans
Black swans are unpredictable market events beyond what is normally expected and carry severe negative consequences for almost everyone. COVID-19 is a perfect example.
So, what is the origin of the term Black Swan?
This is how Nassim Taleb describes it:
"Before the discovery of Australia, people in the Old World were convinced that all swans were white, an unassailable belief as it seemed completely confirmed by empirical evidence. The sighting of the first black swan...illustrates a severe limitation to our learning from observations or experience and the fragility of our knowledge. One single observation can invalidate a general statement derived from millennia of confirmatory sightings of millions of white swans."

Just because something has never been seen before – or has never happened before – doesn't mean that it can't happen. This has key implications in how you manage risk and allocate capital.
After all, these unexpected tail risks have come and gone throughout all of market history. While this volatility can cause investors to panic, it’s helpful to maintain the appropriate perspective and not make knee-jerk reactions in the face of rare and adverse conditions.
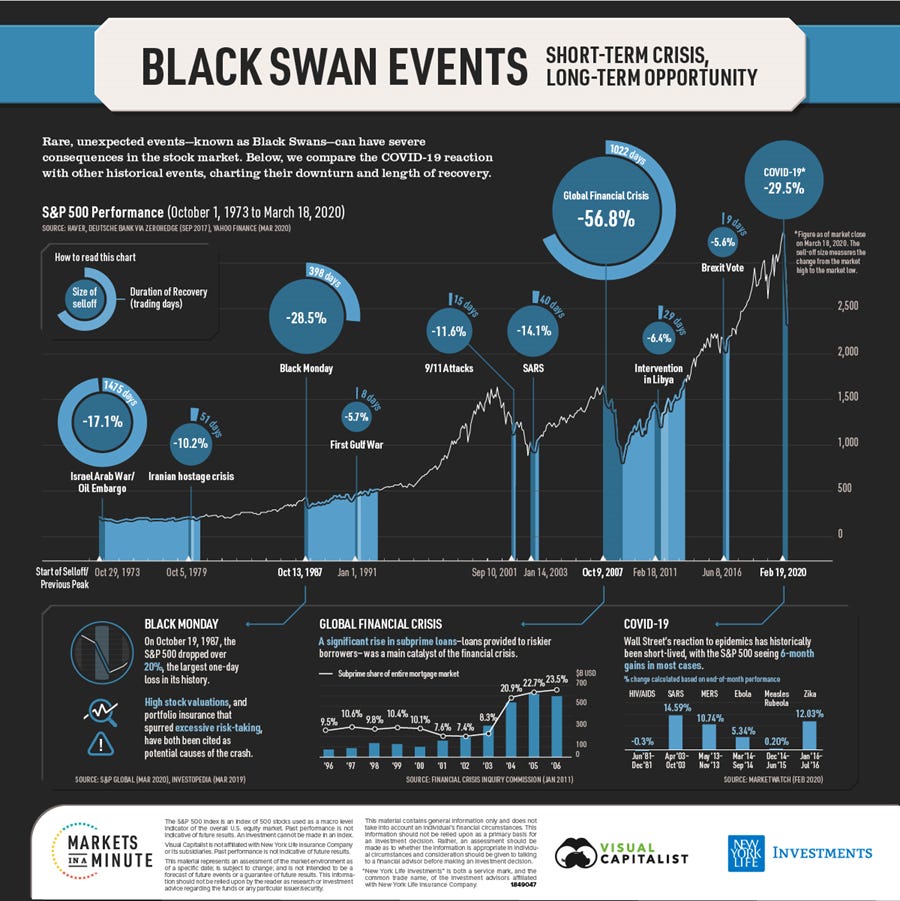
Source: Visual Capitalist
The week in review
Talk of the tape: Fed pivot expectations continue to get a lot of attention as it plays into heightened concerns about a credit crunch and additional collateral damage from the aggressive tightening cycle. Nothing particularly incremental from a macro or Fed policy perspective this week, however total borrowing from the Fed discount window and BTFP was down 3% over the last week. With Q1 closing out, the market’s attention will shift to the corporate earnings cycle with the banks(!!) reporting first.
The Financial Times reported that more than $340 billion has shifted from banks to higher-paying U.S. money market instruments. This trend caught the attention of Treasury Secretary Janet Yellen, per her comments yesterday highlighting the “structural vulnerabilities” of the nonbanks sector.
Bullish dialogues emphasize the Fed’s balance sheet re-expansion, big tech leadership, better risk sentiment surrounding U.S. equities (S&P 500 now up 8 of the last 10 sessions), soft/no landing scenarios, a broader (albeit choppy) disinflation trend, elevated cash levels and still below average positioning, technicals holding strong, and the China reopening story.
Negative areas of focus revolve around the central bank balancing act between inflation and financial stability risks, the higher-for-longer narrative, 10-20% downside risk to consensus earnings estimates, heightened concerns about regional banking and the Commercial Real Estate market, and broadening of layoffs beyond the technology sector.
Stocks: Stocks ended their second consecutive week higher. Energy led all sectors on the back of higher crude oil prices. Investors overlooked banking health concerns, in addition to global central banks’ hawkish response to persistent inflation pressures.
Bonds: The Bloomberg Aggregate Bond Index finished lower as bond prices sold off and yields increased. This reverses two straight weeks of higher performance for the index.
Commodities: Energy prices finished mixed even as traders remain concerned over the present banking climate and its potential effect on the economy. Crude oil rallied for the second straight week after reaching a 15-month low three weeks ago. Natural gas prices declined for the third straight week. The major metals (gold, silver, and copper) ended the week mixed.
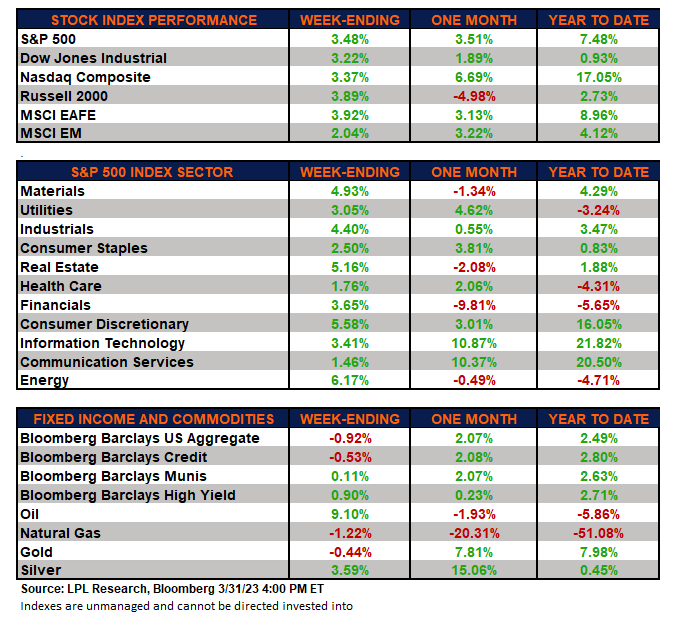
Source: Dwyer Strategy, LPL Research
That’s all for today.
Blake
Welcome to The Sandbox Daily, a daily curation of relevant research at the intersection of markets, economics, and lifestyle. We are committed to delivering high-quality and timely content to help investors make sense of capital markets.
Blake Millard is the Director of Investments at Sandbox Financial Partners, a Registered Investment Advisor. All opinions expressed here are solely his opinion and do not express or reflect the opinion of Sandbox Financial Partners. This Substack channel is for informational purposes only and should not be construed as investment advice. Clients of Sandbox Financial Partners may maintain positions in the markets, indexes, corporations, and/or securities discussed within The Sandbox Daily.