

FIFA World Cup, plus 1 year since Nasdaq peak, improved S&P 500 breadth, and the week in review
The Sandbox Daily (11.18.2022)

Welcome, Sandbox friends.
Today’s Daily discusses the FIFA World Cup Qatar 2022, one year since the Nasdaq Composite index peaked, breadth metrics for the S&P 500 continue to improve, and a brief recap to snapshot the week in markets.
Let’s dig in.
Markets in review
EQUITIES: Dow +0.59% | Russell 2000 +0.58% | S&P 500 +0.48% | Nasdaq 100 0.00%
FIXED INCOME: Barclays Agg Bond -0.14% | High Yield +0.22% | 2yr UST 4.531% | 10yr UST 3.829%
COMMODITIES: Brent Crude -2.45% to $87.74/barrel. Gold +0.32% to $1,769.0/oz.
BITCOIN: -0.64% to $16,656
US DOLLAR INDEX: +0.26% to 106.969
CBOE EQUITY PUT/CALL RATIO: 0.73
VIX: -3.38% to 23.12
FIFA World Cup Qatar 2022
Soccer’s biggest and most prestigious sports event on the planet kicks off on Sunday, November 20 in Doha, Qatar – the World Cup.

You can meet the U.S. team here.

Here are the groupings:

With virtually none of the stadiums or infrastructure needed to host the games and the million plus fans expected to attend, this has turned into the most expensive World Cup ever by a huge margin. In fact, it’s costing Qatar over four and a half times the total cost of the prior 8 World Cups combined – as they have built 7 new stadiums, a new airport, a new metro system, 100 hotels, multiple new highways, and even a whole new city to host the final match.
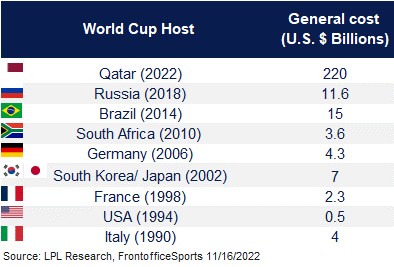
Source: FIFA, LPL Research
1 year anniversary from the Nasdaq peak
One year ago, on November 19, 2021, the Nasdaq Composite closed at an all-time high. Since then? Interest rate hikes, job layoffs, implosions, war, heightened investor fear, currency crises, crypto blowups, and dismal performance.
Let’s take a look at the major asset classes over the last year.
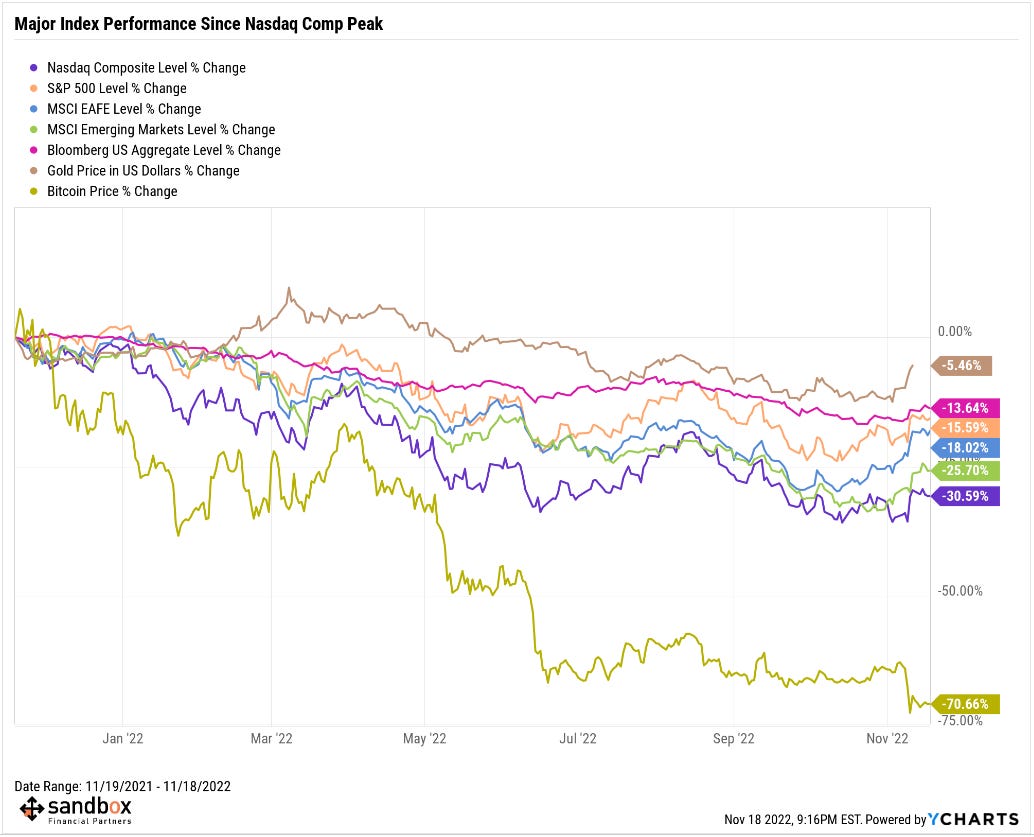
Ouch. It’s been a very difficult year for all investors alike.
Source: Sandbox Financial Partners
More stocks participating in the rally off the mid-October lows
Breadth metrics for the S&P 500 have improved as the S&P 500 has reclaimed the 4000 level, and the door is now open for a run at the 4100-4200 zone. It’s encouraging to see the percentage of stocks trading above their respective 200-day moving averages continue to improve, a sign that stronger short-term metrics are beginning to drift into the long-term metrics.
Advance/Decline Line: holding above the 50-day moving average
S&P 500 % of issues above their 20-Day Moving Average: 81%, from 66% last week
S&P 500 % of issues above their 50-Day Moving Average: 80%, from 58% last week
S&P 500 % of issues above their 200-Day Moving Average: 50%, from 35% last week
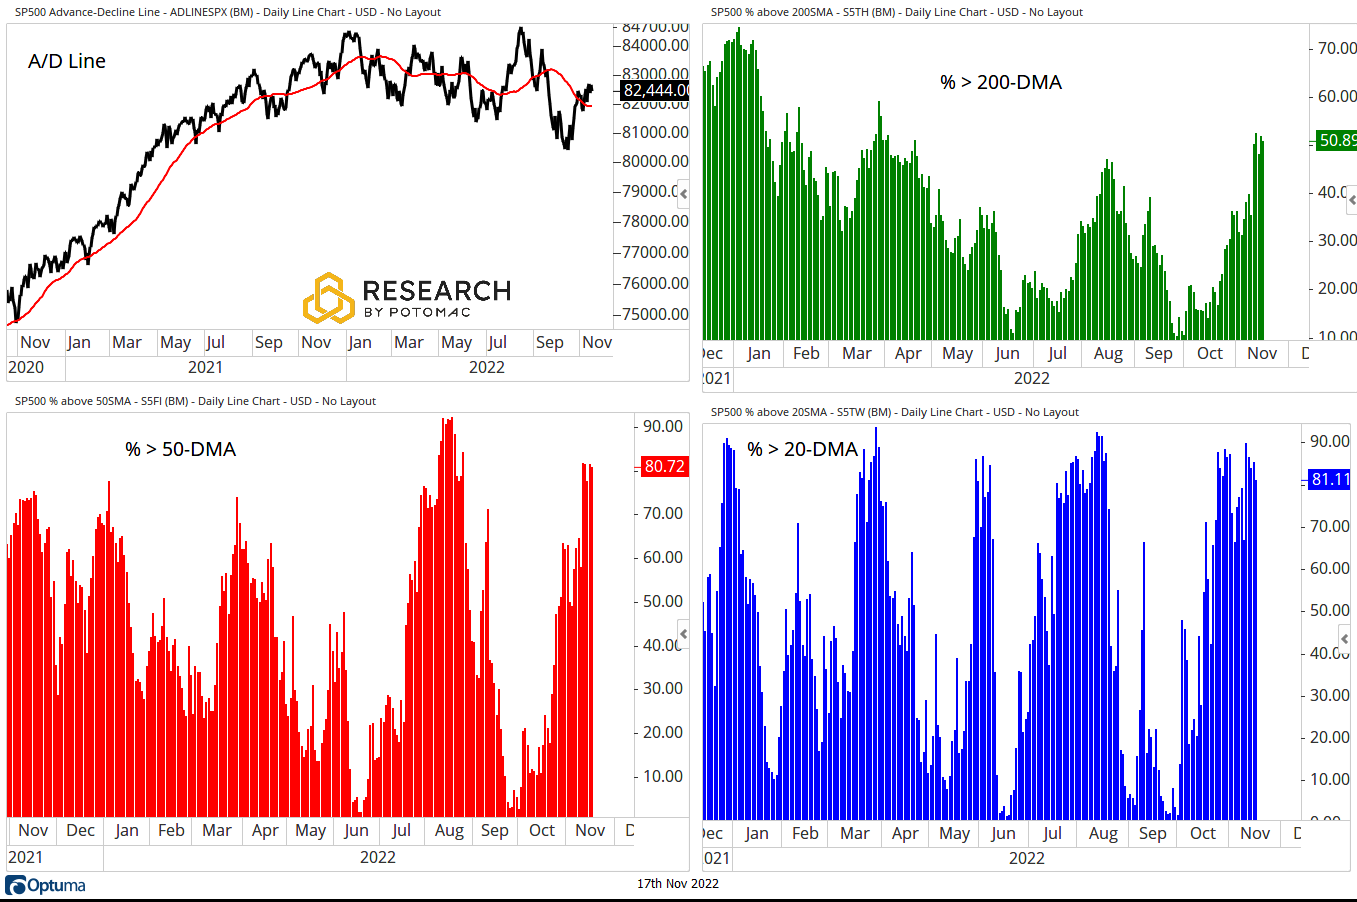
Source: Potomac Fund Management
The week in review
Market drivers: Lots of chop, but little change for the week, with the S&P 500 index lower by -0.69%, its smallest percentage change in the last 15 weeks.
Bullish talking points continue to revolve around cooler-than-expected October inflation prints, Fed officials' implicit blessing of a slowdown in the pace of tightening, seasonality, buybacks, positioning, big equity inflows, resilient consumer balance sheets, China zero Covid tweaks and property support measures, and European gas storage dynamics.
Bearish talking points include Fed focus on upside risk to terminal rate, recession signaling from curve inversion, elevated macro uncertainty/softer demand messaging from companies, expectations for outsized negative earnings revisions, housing downturn, lagged China reopening, and lingering geopolitical tensions.
Stocks: Stocks finished the week lower after last week’s nearly +6% increase for the S&P 500 index. Mixed retail earnings amid consumer financial health concerns, in addition to some pointed “Fedspeak,” have influenced this week’s market results. U.S. mortgage rates recorded their biggest weekly decline since 1981, as a rapid increase in rates this year has quickly priced out many potential homebuyers.
Bonds: The Bloomberg Aggregate Bond Index finished the week higher as yields continue to decline on expectations of a less aggressive Fed, following on from last week’s inflation report and this week’s Fedspeak. Markets have embraced a downshift in Fed rate hikes, with a fifth consecutive 75 bps hike next month no longer the consensus. In addition, high-yield corporate bonds, as tracked by the Bloomberg High Yield index, gained ground for the week. Demand for high yield exposure spiked last week following the cooler-than-expected inflation print. Two of the largest high yield bond ETFs each had over $2B of inflows in a single day last week—the largest single day inflows on record.
Commodities: Oil and natural gas prices finished the week mixed. Most are expecting natural gas prices to see increased volatility for the rest of 2022 and into 2023 over concerns about reduced supplies given the Eastern European crisis, in addition to increased European and North American seasonal demand as we head into the winter months. Gold, silver, and copper all finished lower in a rough year so far for the metals.
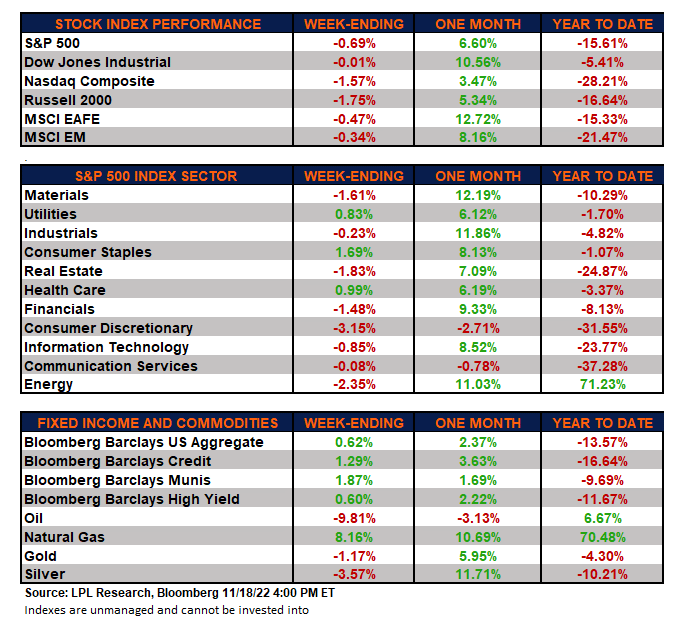
Source: Dwyer Strategy, LPL Research
That’s all for today.
Blake
Welcome to The Sandbox Daily, a daily curation of relevant research at the intersection of markets, economics, and lifestyle. We are committed to delivering high-quality and timely content to help investors make sense of capital markets.
Blake Millard is the Director of Investments at Sandbox Financial Partners, a Registered Investment Advisor. All opinions expressed here are solely his opinion and do not express or reflect the opinion of Sandbox Financial Partners. This Substack channel is for informational purposes only and should not be construed as investment advice. Clients of Sandbox Financial Partners may maintain positions in the markets, indexes, corporations, and/or securities discussed within The Sandbox Daily.