Fitch puts U.S. on credit watch, plus S&P 500 looking for expansion, bond market, two key risk metrics, and supply chains
The Sandbox Daily (5.25.2023)
Welcome, Sandbox friends.
Today’s Daily discusses:
Fitch puts the U.S. on credit watch
August 2022 highs next for the S&P 500?
bond market pricing out rate cuts
Apollo monitoring two key risk metrics for near-term outlook
supply chain metrics have normalized to pre-pandemic conditions
Let’s dig in.
Markets in review
EQUITIES: Nasdaq 100 +2.46% | S&P 500 +0.88% | Dow -0.11% | Russell 2000 -0.70%
FIXED INCOME: Barclays Agg Bond -0.37% | High Yield -0.07% | 2yr UST 4.537% | 10yr UST 3.823%
COMMODITIES: Brent Crude -2.69% to $76.25/barrel. Gold -1.05% to $1,962.3/oz.
BITCOIN: +0.25% to $26,470
US DOLLAR INDEX: +0.32% to 104.218
CBOE EQUITY PUT/CALL RATIO: 0.77
VIX: -4.44% to 19.14
Quote of the day
“The more you diversify by increasing the number of different investments you must understand, the more you risk increasing your not knowing as much about each investment as your best competitor investors.”
- Dr. Charles Ellis, Winning the Loser's Game
Fitch puts the U.S. on credit watch
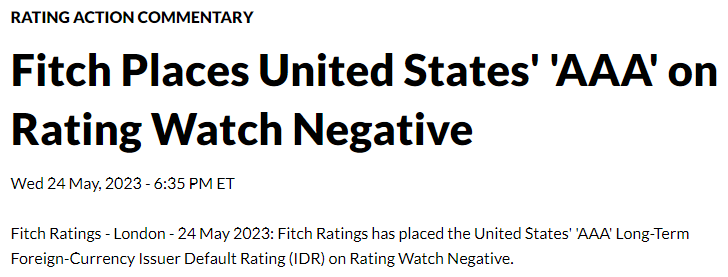
The deadlock in Congress has taken America to the brink of default and could jeopardize the United States’ perfect credit rating, Fitch said in a stern warning last night.
The credit ratings agency placed the pristine AAA credit rating for the United States on a negative rating watch, reflecting the uncertainty surrounding the current debt ceiling debate and the possibility of a first-ever default. Fitch blamed “debt ceiling brinkmanship” but also said that they “would expect the U.S country ceiling to remain at 'AAA' even in the scenario of a debt default.”
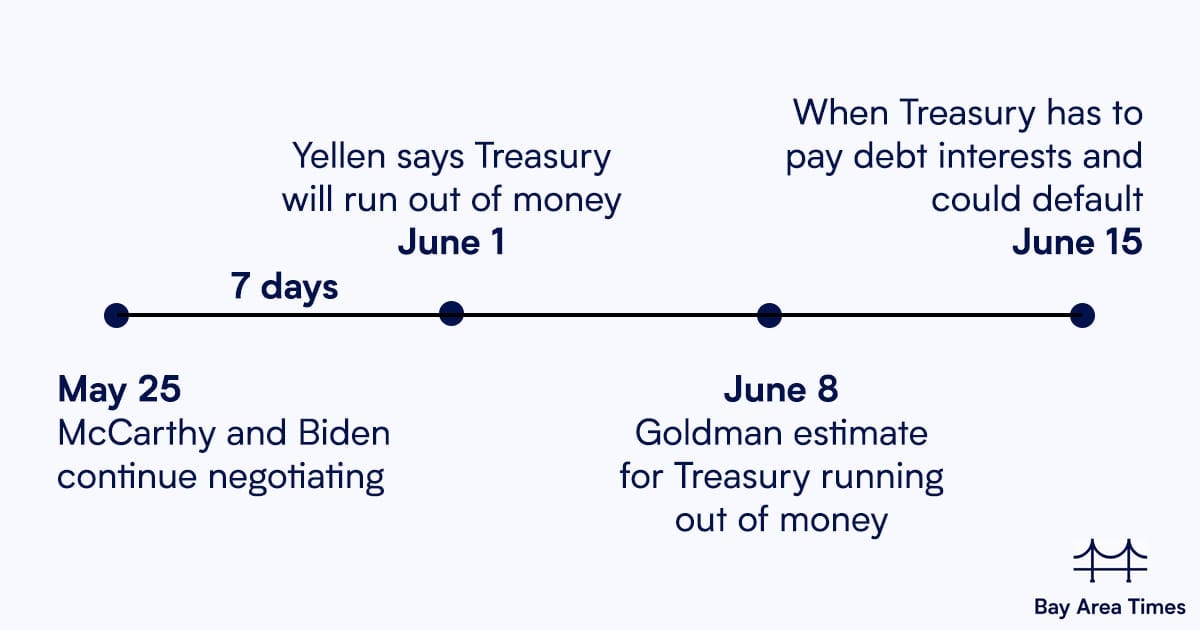
The “X-date” is one week away on June 1st according to U.S. Secretary of the Treasury, Janet Yellen.
J.P Morgan bond analysts released a note saying, “In the unlikely event of a technical default, we think front-end yields would decline materially, as markets incorporate expectations of more aggressive Fed easing.” Translation? Investors will respond to a default on U.S. Treasury bills by… buying more U.S. Treasury bills. The common "flight to safety" dynamic – when buyers rush to buy Treasuries in the face of a shock – may endure, even when the source of the shock is actually Treasuries themselves.
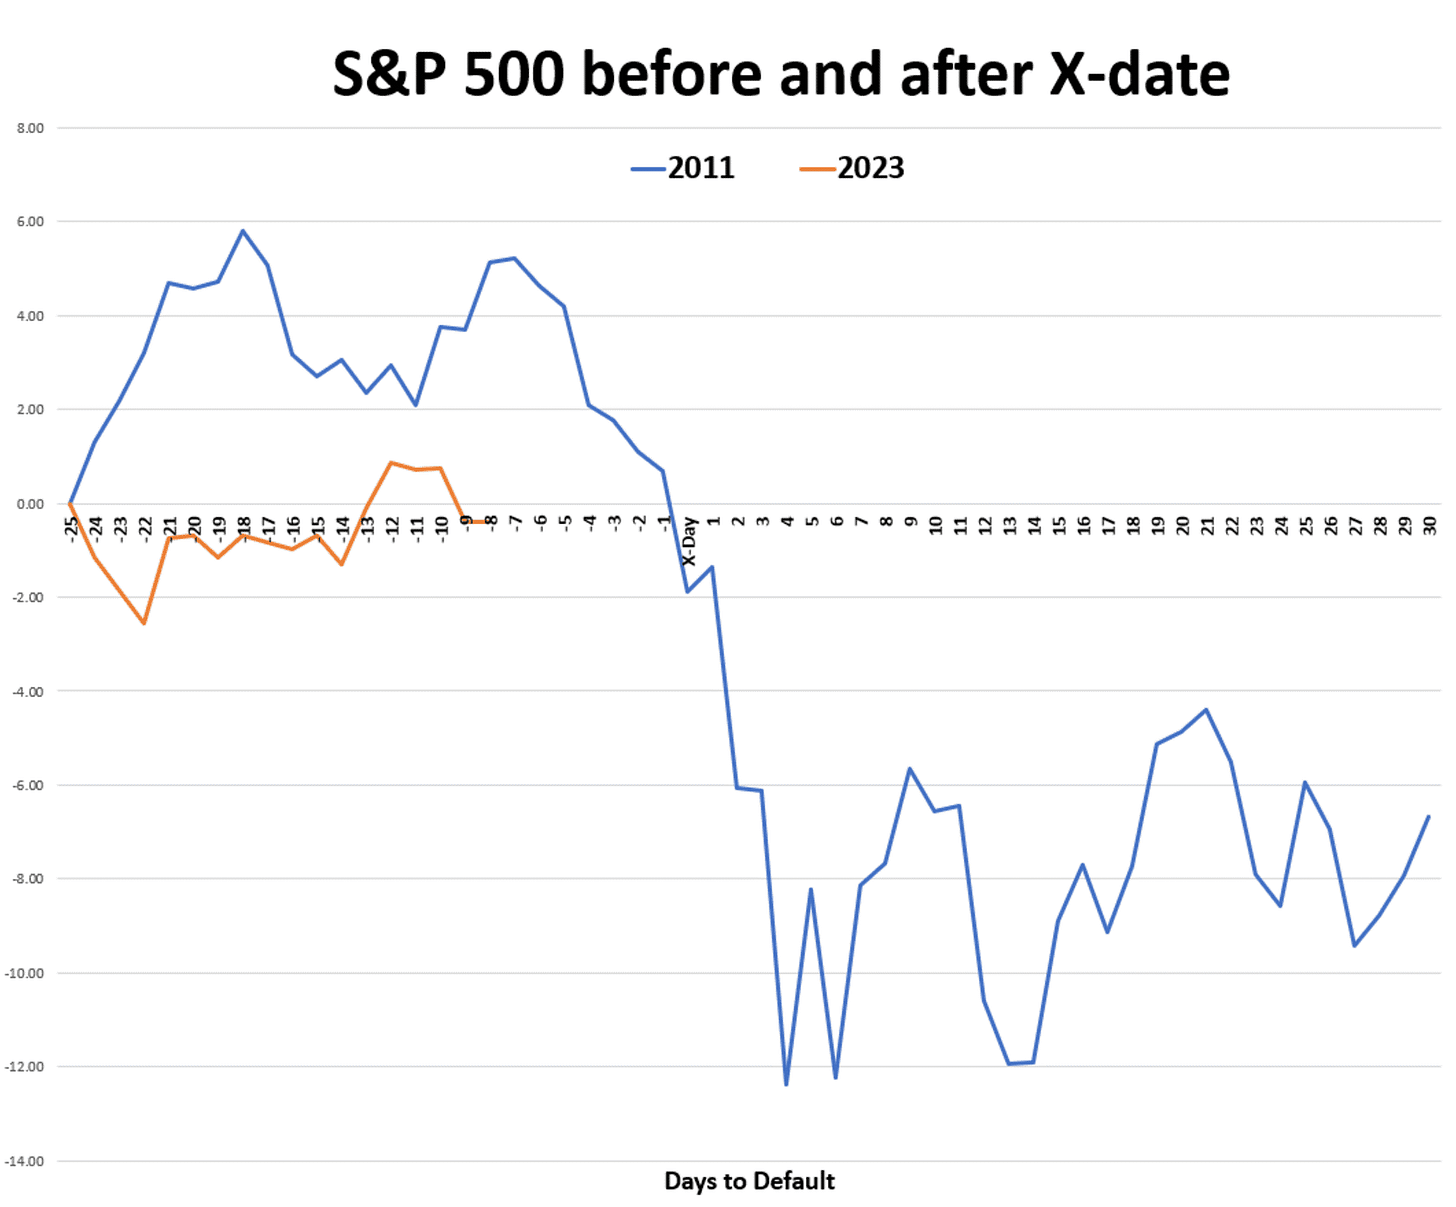
Meanwhile, in the equity markets, the S&P 500 index is shrugging off any near-term risks. The market heading into the X-date is tracking eerily similar to 2011, when the last debt ceiling standoff went down to the 11th wire before the Standard & Poor’s credit rating agency downgraded U.S. sovereign debt from the highest AAA rating to AA+.
Source: Fitch Ratings, Bloomberg, Axios, CNBC
August 2022 highs next?
When looking at many individual stock charts these days, the August 2022 highs pop up a lot. This is when last summer’s rally topped out, and the major stock indices have been more or less below this level ever since.
These levels are a major line in the sand, as the promise of a new uptrend lies just above these key levels for so many names.
When it comes to the indexes, it’s the same story, with the Nasdaq 100 (QQQ) currently testing its August highs as the S&P 500 (SPY) is just a stone's throw away.
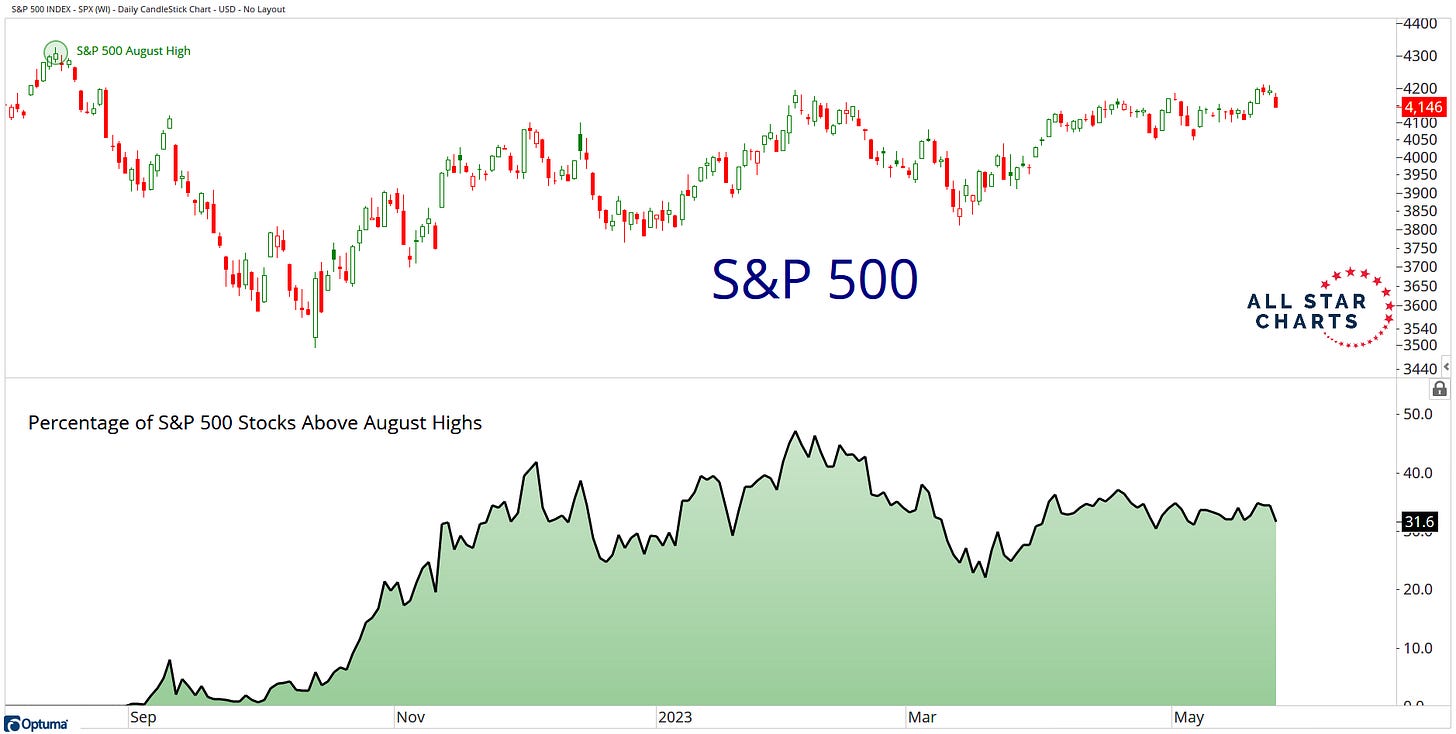
Here’s a look at the S&P 500 along with the percentage of components above their respective highs from August:
The indicator in the lower pane is simply telling us how many stocks beneath the surface are above their August equivalent levels. Things haven’t been moving in the right direction for the bulls, as this indicator peaked in the first quarter and has drifted lower since.
While there is no magic number for the percentage of stocks that bulls would like to see above these former highs, it would be a bullish signal to see improvement. For market internals to confirm new highs at the index level, we would need to see an increasing number of stocks reclaim their old highs beneath the surface. Participation would need to expand if the S&P is going to move higher from current levels.
Source: All Star Charts
Bond yields are moving higher
U.S. Treasury yields are generally higher over the past week with the 2-year Treasury trading around 4.4-4.5%.
The 0.50% increase in the 2-year Treasury yield since early last week is largely due to markets pricing out rate cuts later this year.
General consensus is the market was too optimistic for the amount of rate cuts being priced in. Markets now expect one cut this year, which may still be too rosy, unless financial conditions deteriorate.
This next chart from Hi Mount Research shows how fluid and difficult the bond market finds the future path of interest rates because of an uncertain policy and economic outlook.
“Year-end rate expectations are not yet back to their early March highs, but they have risen 50 basis points over the past two weeks and are more than 100 basis points higher than their post-SVB lows.”
Source: LPL Research, CME FedWatch Tool, Hi Mount Research
Apollo eyes two key metrics for the near-term outlook
There are two downside risks to the outlook for the economy and markets.
The first is rates higher for longer because of sticky inflation driven by high wage inflation and the ongoing recovery in the housing market.
The second is the ongoing tightening in credit conditions with banks holding back lending.
Source: Apollo Global Management
Supply chain metrics have normalized to pre-pandemic conditions
“Our aggregate index of most-watched supply chain metrics continues to maintain below-average levels with Consumer Inflation Expectations being the only real outlier,” data analytics firm Arbor Data Science said in a recent report.
No metric better quantifies the normalization process than shipping rates. From the March 2020 low to the September 2021 peak, shipping rates per container for the Shanghai to Los Angeles route shot up by +836%... only to have collapsed by -85%. This shipping container round trip is a microcosm of easing across the supply chain.
Source: Arbor Data Science, Liz Ann Sonders
That’s all for today.
Blake
Welcome to The Sandbox Daily, a daily curation of relevant research at the intersection of markets, economics, and lifestyle. We are committed to delivering high-quality and timely content to help investors make sense of capital markets.
Blake Millard is the Director of Investments at Sandbox Financial Partners, a Registered Investment Advisor. All opinions expressed here are solely his opinion and do not express or reflect the opinion of Sandbox Financial Partners. This Substack channel is for informational purposes only and should not be construed as investment advice. Clients of Sandbox Financial Partners may maintain positions in the markets, indexes, corporations, and/or securities discussed within The Sandbox Daily.


