

Front-loading risks, then offloading them over time -> seeking a tradable bottom in this market
The Sandbox Daily (3.11.2025)

Welcome, Sandbox friends.
Today’s Daily discusses:
seeking a tradable bottom using volatility as a guide
Let’s dig in.
Blake
Markets in review
EQUITIES: Russell 2000 +0.22% | Nasdaq 100 -0.28% | S&P 500 -0.76% | Dow -1.14%
FIXED INCOME: Barclays Agg Bond -0.35% | High Yield -0.35% | 2yr UST 3.947% | 10yr UST 4.278%
COMMODITIES: Brent Crude +0.82% to $69.85/barrel. Gold +0.81% to $2,922.8/oz.
BITCOIN: +4.91% to $82,749
US DOLLAR INDEX: -0.53% to 103.423
CBOE TOTAL PUT/CALL RATIO: 0.92
VIX: -3.37% to 26.92
Quote of the day
“Winners never quit, and quitters never win.”
- Vince Lombardi
Interpreting potential buy signals from the volatility curve
The VIX curve shows how investors expect stock market volatility to change throughout time, with short-term expectations on the left and longer-term expectations on the right.
Normally, the curve slopes upward because investors expect more uncertainty further into the future. Intuitively, this should make sense; the longer the time frame, the greater the range of possible outcomes. This is the blue line below “February 2025,” capturing the market’s expectations for S&P 500 volatility over the coming months (dated a/o one month ago, February 10).
When the VIX curve inverts, it means short-dated volatility is higher than long-dated volatility, signaling immediate fear or uncertainty in the market. This “backwardation” means investors are seeking a greater level of protection now; an inverted volatility futures curve is quite uncommon. See the white line below “March 2025,” which highlights today’s pricing of volatility over roughly the next six months.

Today’s inverted VIX curve means investors are more worried about the present than the future, and if past is prologue, these inversions occur only after an extreme expansion in volatility – periods that coincide with market sell-offs, economic shocks, or major risk events, as traders rush to buy protection against near-term risks.
The 2025 tariff war is the perfect example.
Investors should pay attention because it may signal buying opportunities – the formation of a “tradable bottom” – when fear subsides.
Why is this?
Generally speaking, when volatility rapidly expands, it doesn’t stay extremely elevated for too long. Because the VIX is based on SPY options prices, it needs a constant flow of new demand for option contract premiums to remain high.
When demand for protection dries up, volatility can quickly collapse – creating environments supportive of risk assets for the average long-only investor.
As Tom Lee of Fundstrat recently noted on The Compound and Friends: “So, what the markets have now priced in, today’s volatility has an expiration date.”
The VIX peaking and then declining often signals the top is in for fear – in other words, front-loading the risks, then offloading them over time. The problem is we just don’t know if the VIX has peaked yet.
As you can see below, the VIX was as low as 14.77 on February 14. Today we’re up nearly 2x at 27.86. That’s a fairly rapid expansion in volatility and signals near-term panic.

The chart below is Charlie’s golden ticket.
Assuming we are close to the “local” top in the VIX, recent history has shown the peak inversion of the VIX curve has marked a tradable bottom in stocks multiple times.
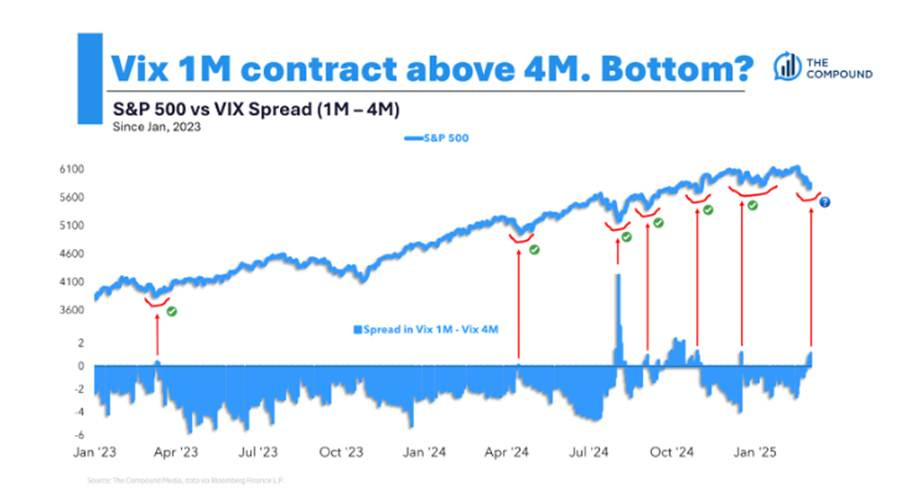
In the coming days/weeks/hopefully not months, look for the VIX term structure (1-month less 4-month) to dis-invert as being a positive signal for risk assets. In the past, these have marked tradable lows for equities.
Sources: Bloomberg Odd Lots, YCharts, The Compound and Friends, Irrelevant Investor
That’s all for today.
Blake
Questions about your financial goals or future?
Connect with a Sandbox financial advisor – our team is here to support you every step of the way!
Welcome to The Sandbox Daily, a daily curation of relevant research at the intersection of markets, economics, and lifestyle. We are committed to delivering high-quality and timely content to help investors make sense of capital markets.
Blake Millard is the Director of Investments at Sandbox Financial Partners, a Registered Investment Advisor. All opinions expressed here are solely his opinion and do not express or reflect the opinion of Sandbox Financial Partners. This Substack channel is for informational purposes only and should not be construed as investment advice. The information and opinions provided within should not be taken as specific advice on the merits of any investment decision by the reader. Investors should conduct their own due diligence regarding the prospects of any security discussed herein based on such investors’ own review of publicly available information. Clients of Sandbox Financial Partners may maintain positions in the markets, indexes, corporations, and/or securities discussed within The Sandbox Daily. Any projections, market outlooks, or estimates stated here are forward looking statements and are inherently unreliable; they are based upon certain assumptions and should not be construed to be indicative of the actual events that will occur.
Please see additional disclosures at the Sandbox Financial Partners website: