

Gaps EVERYWHERE, plus 10 demons, market concentration, bear markets, and Retail Sales
The Sandbox Daily (11.15.2023)

Welcome, Sandbox friends.
Today’s Daily discusses:
4 types of gaps, simplified
10 demons of investing
market concentration
bear markets: recession vs. non-recession
consumer spending slows ahead of key holiday season
Let’s dig in.
Markets in review
EQUITIES: Dow +0.47% | Russell 2000 +0.16% | S&P 500 +0.16% | Nasdaq 100 +0.03%
FIXED INCOME: Barclays Agg Bond -0.62% | High Yield -0.32% | 2yr UST 4.914% | 10yr UST 4.537%
COMMODITIES: Brent Crude -1.76% to $81.02/barrel. Gold -0.17% to $1,963.1/oz.
BITCOIN: +5.86% to $37,651
US DOLLAR INDEX: +0.34% to 104.402
CBOE EQUITY PUT/CALL RATIO: 0.74
VIX: +0.14% to 14.18
Quote of the day
“The best kept secret in the investing world: Almost nothing turns out as expected.”
- Harry Browne
4 types of gaps, simplified
In November, we’ve witnessed numerous breakaway and runaway gaps across many different indexes, sectors, and stocks – the most recent examples being this week in response to the softer-than-expected inflation report.
They’re impossible to ignore.
One technical analyst after another is mentioning/discussing it on CNBC, Bloomberg, and Fox Business. So, let’s spend a few minutes together discussing what gaps are.
A gap is an area on a chart where the price of a security moves sharply up or down, with little or no trading in between.

Why are gaps important? They create opportunities. And whether you have your trader hat or investor hat on, we are collectively always looking for opportunities.
Market technicians have identified 4 types of market gaps (reference chart above):
Common gaps: This is the most frequent type and often occur when price is range-bound. These types of gaps are not big in size and get filled relatively quickly. These gaps do not provide much of a signal.
Breakaway gaps: Created as price breaks away from a consolidation phase, often gapping over a support/resistance level and typically signals a direction.
Runaway gaps: Gaps that occur in the middle of uptrends, showing a trend continuation signal and can suggest momentum is building. Preferably, these gaps are not too large in size to confirm sustainability. These represent buyers who did not get in during the beginning of the uptrend.
Exhaustion gaps: Gaps that happen at the end of a trend and can signal a reversal, showing the trend has changed. Price makes one final gap in the direction of the underlying trend on momentum exhaustion and then rollover.
Here is a recent chart of DraftKings Inc. ($DKNG) that demonstrates examples of each type of gap:

Gaps are used in concert with other tools to help investors and traders alike understand the market behavior of buyers and sellers.
Source: TrendSpider, Trading View, Sunil Gurjar CFTe
10 demons of investing
They all reside within us. It’s our choice how often we feed them.

No investor can claim to master or remove these demons entirely, but having the self-awareness that they reside among us can be helpful in gaining insight into the emotions that stand between the investor and his long-term success.
Source: Vishal Khandelwal
Market concentration
10 years ago, Apple was the largest constituent in the S&P 500 index at 2.81%. Today, 5 companies have a bigger weight than Apple did 10 years ago.

The increase in index concentration over the prior decade has people’s attention, especially as the share of corporate profits generated from the top stocks in the index is falling despite higher stock prices:

Source: Bespoke Investment Group, JPMorgan Guide to the Markets
Bear markets: recession vs. non-recession
Not all cyclical bear markets are created equal. About half overlap with recessions and half do not.
Recession bears tend to be more severe in time and price, while non-recessionary bears are less harsh.
Since 1900, recession bears have averaged a -34.6% decline over 11.6 months, vs. -25.2% over 7.0 months for non-recession bear markets.

Source: Ned Davis Research
Consumer spending slows ahead of key holiday season
Retail Sales declined in October, but less than expected as consumer demand holds up better than economists had anticipated.
Retail Sales fell -0.1% last month, down for the first time since March.
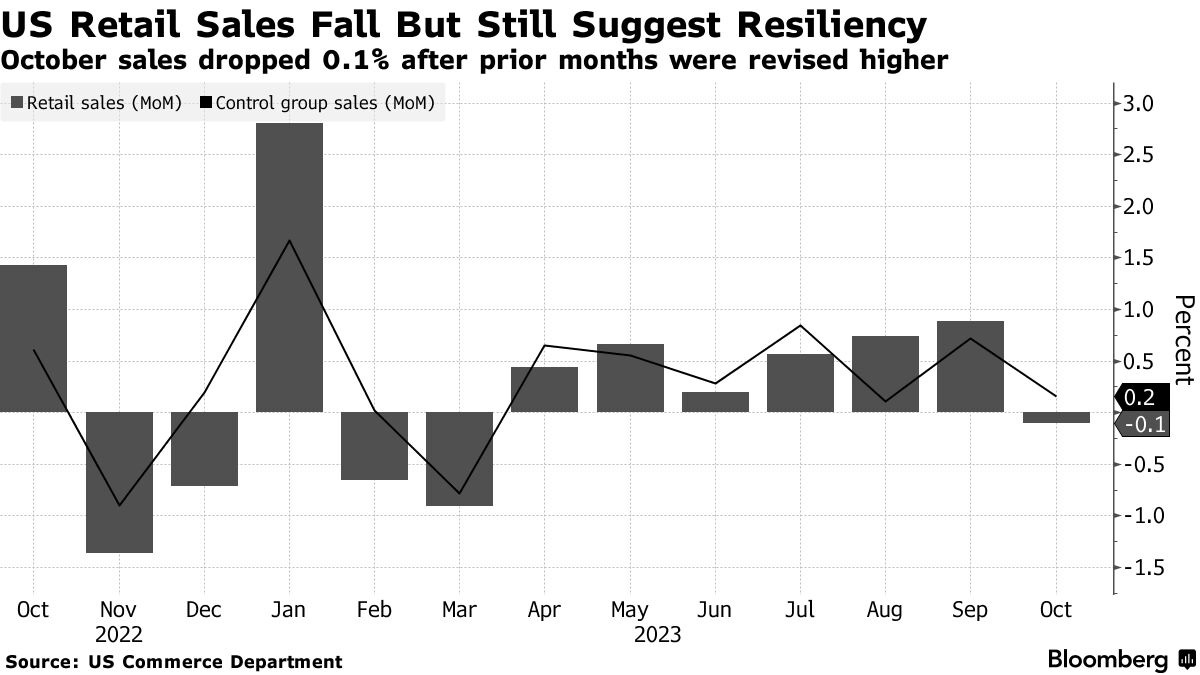
At first glance, a drop in Retail Sales might be concerning for stores as the holiday shopping season is just around the corner. However, falling auto (-1.1%) and gasoline (-0.3%) prices were the main drivers for the decline.

Next weekend, holiday shopping ramps up with Black Friday, Small Business Saturday, and Cyber Monday – which collectively will be instructive to how well consumer spending holds up and where economic growth will fall in Q4.
Also consider student loan payments resumed last month, which potentially weighed on sales growth and could be a drag in the coming months.
Source: Ned Davis Research, Bloomberg, Mike Zaccardi
That’s all for today.
Blake
Welcome to The Sandbox Daily, a daily curation of relevant research at the intersection of markets, economics, and lifestyle. We are committed to delivering high-quality and timely content to help investors make sense of capital markets.
Blake Millard is the Director of Investments at Sandbox Financial Partners, a Registered Investment Advisor. All opinions expressed here are solely his opinion and do not express or reflect the opinion of Sandbox Financial Partners. This Substack channel is for informational purposes only and should not be construed as investment advice. The information and opinions provided within should not be taken as specific advice on the merits of any investment decision by the reader. Investors should conduct their own due diligence regarding the prospects of any security discussed herein based on such investors’ own review of publicly available information. Clients of Sandbox Financial Partners may maintain positions in the markets, indexes, corporations, and/or securities discussed within The Sandbox Daily. Any projections, market outlooks, or estimates stated here are forward looking statements and are inherently unreliable; they are based upon certain assumptions and should not be construed to be indicative of the actual events that will occur.