Gold on the move, plus SPX valuation edging higher, credit spreads, and global manufacturing
The Sandbox Daily (4.10.2024)
Welcome, Sandbox friends.
Today’s Daily discusses:
gold on the move
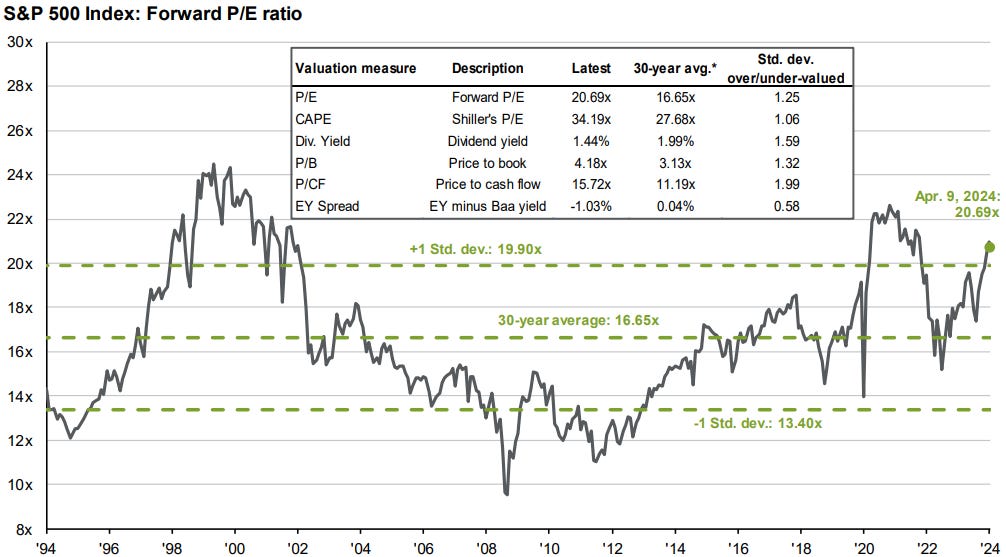
S&P 500 index valuation 1 standard deviation expensive
U.S. corporate bond spreads hitting abnormally low levels
global manufacturing accelerates
Today’s inflation report came in above expectations – inciting a broad, risk-off degrossing. Yields ripped higher as 2024’s back-to-back-to-back hot inflation prints are further derailing any interest rate cuts planned by the Federal Reserve. It showed the progress on the “final mile” for bringing down inflationary pressures is not budging as fast as the Fed would like.
Let’s dig in.
Markets in review
EQUITIES: Nasdaq 100 -0.87% | S&P 500 -0.95% | Dow -1.09% | Russell 2000 -2.52%
FIXED INCOME: Barclays Agg Bond -1.20% | High Yield -0.88% | 2yr UST 4.975% | 10yr UST 4.548%
COMMODITIES: Brent Crude +1.14% to $90.44/barrel. Gold -0.51% to $2,350.6/oz.
BITCOIN: +1.08% to $69,801
US DOLLAR INDEX: +1.01% to 105.187
CBOE EQUITY PUT/CALL RATIO: 0.72
VIX: +5.47% to 15.80
Quote of the day
“I have not failed. I’ve just found 10,000 ways that won’t work.”
- Thomas Edison
Gold’s recent move
New all-time highs have a funny way of changing the narrative.
After peaking in 2011, gold went nowhere for a decade as it consolidated the prior decade’s monster gains. Then, everything changed last month when gold rocketed to its highest recorded level ever.
Over the last 100 days, gold has rallied +20%. This is close to a 2-standard deviation move (23.0%).
History back to 2000 shows the current rally can only continue if there are secular (not cyclical) tailwinds.
Rising geopolitical tensions, growing debt loads, and record-high central bank purchases (see below) are catalysts that fit the bill.
A big reason behind central banks' gold buying is that central banks don't trust the global financial system, Francisco Blanch, head of global commodity and derivatives research at BofA Securities, told Axios.
Source: All Star Charts, Bloomberg, Axios
S&P 500 index valuation 1 standard deviation expensive
The S&P 500 currently trades for 20.7x forward earnings, well above its 5- and 10-yr averages of 19.1x/17.7x.
While that’s an uncomfortable truth for investors to digest, valuations generally contract only when recession concerns grow quickly. Otherwise, valuations hold steady or increase.
Source: J.P. Morgan Guide to the Markets
U.S. corporate bond spreads hitting abnormally low levels
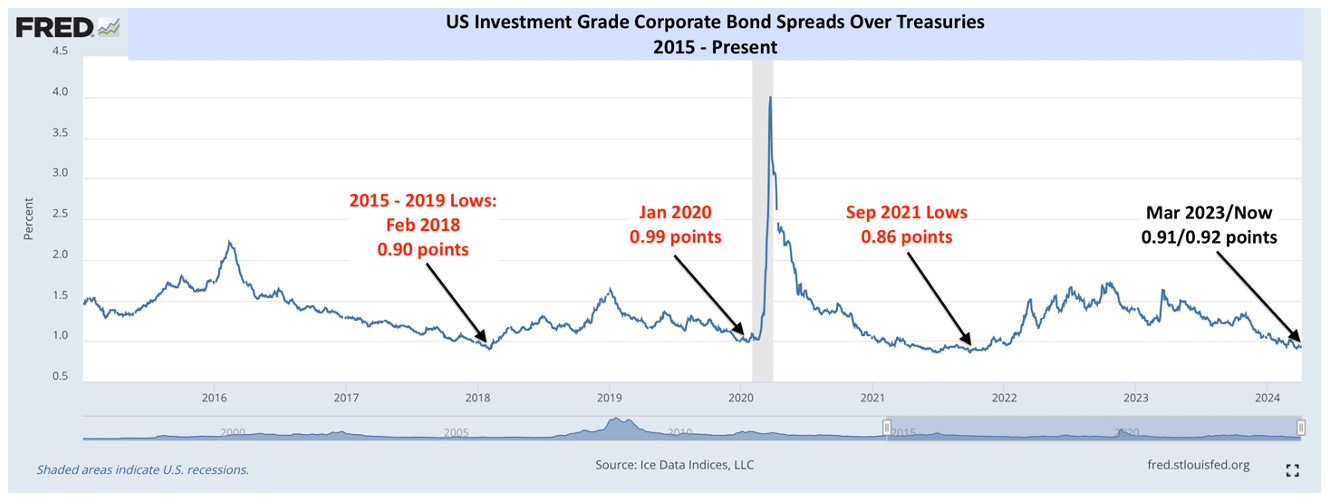
U.S. corporate bond spreads are very close to 15 years lows. On one hand, that’s comforting – no recession around the corner. On the other hand, it’s also a bit concerning – excessive confidence in the status quo and amidst rising geopolitical tensions.
As a reminder, the difference between risk-free Treasury yields and those for any other bond is called a “spread”. In the case of corporate bonds, when spreads rise/fall it signals growing/lessening concern about future economic growth.
The following chart shows investment grade (IG) corporate bond spreads from 2015 to the present. The current spread of 0.92 points is within 1-2 basis points of the 2015-2019 lows (which are also the 2010-2019 lows). Only 2021, with its unique combination of fiscal and monetary stimulus, saw slightly lower spreads (0.86 points in September 2021).
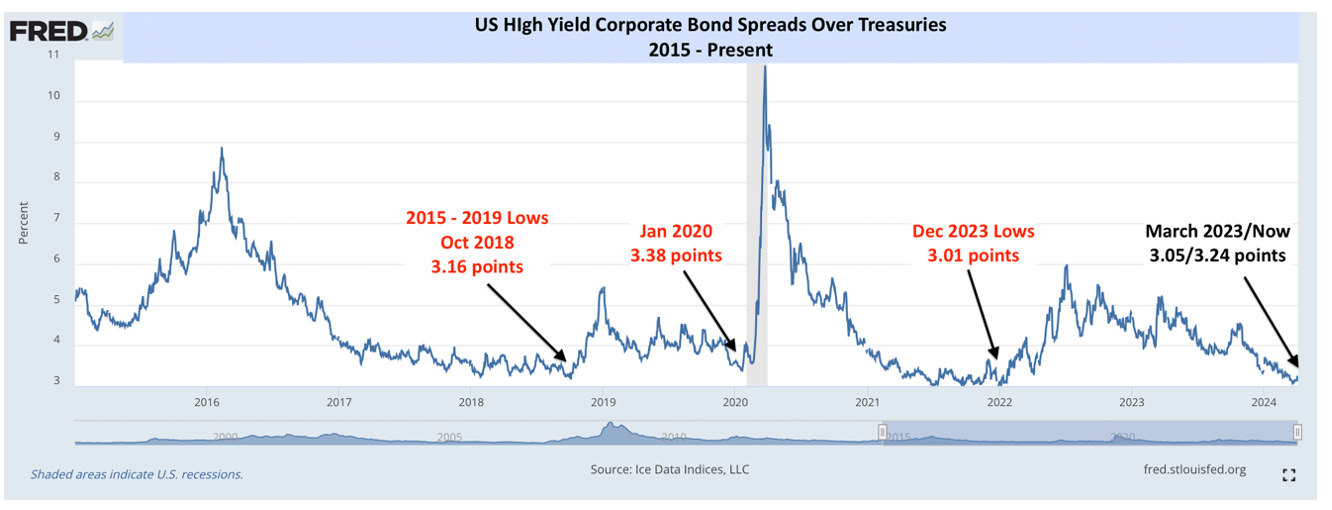
Here is the same spread data and timeframe, but for high yield (HY) corporate bonds.
The current spread (3.14) has recently been lower than their 2015-2019 lows (3.16 low in October 2018, 3.05 points in March 2024) and very close to the 2021 lows (3.01 points).
Has macro confidence perhaps gone too far, or is the stock market just confirming the same rosy outlook as the bond market?
Source: St. Louis Fed (1), St. Louis Fed (2), DataTrek Research
Global manufacturing accelerates
Last week, global manufacturing clocked in its 2nd month of expansion (>50), as the sector’s PMI climbed 0.3 points to 50.6 in March, the highest since July 2022.
These gains follow a record 17 months of contraction, adding further signs that the global manufacturing recession, which had started in mid-2022, has ended and further indicates diminishing risk of a sustained global slowdown.
New Orders expanded the most in two years, helped by a milder contraction in Export Orders, which suggests a pick-up in global trade volumes in the coming months.
Meanwhile, Inventories contracted modestly.
As a result, the global bullwhip, the difference between the New Orders and Inventories indexes and a leading indicator for future output, rose to its highest level in over two years.
Source: Trading Economics, Ned Davis Research
That’s all for today.
Blake
Welcome to The Sandbox Daily, a daily curation of relevant research at the intersection of markets, economics, and lifestyle. We are committed to delivering high-quality and timely content to help investors make sense of capital markets.
Blake Millard is the Director of Investments at Sandbox Financial Partners, a Registered Investment Advisor. All opinions expressed here are solely his opinion and do not express or reflect the opinion of Sandbox Financial Partners. This Substack channel is for informational purposes only and should not be construed as investment advice. The information and opinions provided within should not be taken as specific advice on the merits of any investment decision by the reader. Investors should conduct their own due diligence regarding the prospects of any security discussed herein based on such investors’ own review of publicly available information. Clients of Sandbox Financial Partners may maintain positions in the markets, indexes, corporations, and/or securities discussed within The Sandbox Daily. Any projections, market outlooks, or estimates stated here are forward looking statements and are inherently unreliable; they are based upon certain assumptions and should not be construed to be indicative of the actual events that will occur.


