Hard landing scenario, plus monetary policy, pre- vs. post-pandemic employment, Caterpillar, and investing ≠ gambling
The Sandbox Daily (1.10.2023)
Welcome, Sandbox friends.
Today’s Daily discusses the hard landing scenario, the monetary policy tightening cycle in 2022, U.S. employment pre- vs. post-pandemic, strength in bellwether Caterpillar (CAT), and investing ≠ gambling.
Let’s dig in.
Markets in review
EQUITIES: Russell 2000 +1.49% | Nasdaq 100 +0.88% | S&P 500 +0.70% | Dow +0.56%
FIXED INCOME: Barclays Agg Bond -0.38% | High Yield -0.12% | 2yr UST 4.247% | 10yr UST 3.615%
COMMODITIES: Brent Crude -0.03% to $79.63/barrel. Gold +0.19% to $1,881.3/oz.
BITCOIN: +1.45% to $17,438
US DOLLAR INDEX: +0.27% to 103.278
CBOE EQUITY PUT/CALL RATIO: 0.58
VIX: -6.33% to 20.58
Hard landing
The macro backdrop remains incredibly uncertain as we begin 2023, with many cross currents suggesting a wide range of outcomes are plausible for both the markets and the economy. Investors are anxious.
If you are bearish on markets, here are 10 reasons to believe a recession is likely in 2023:
The percentage of U.S. Treasury yield curves that are inverted
Oil shock in 2022
Restrictive monetary policy cycle (rate hikes + QT)
The negative reading in the Conference Board Leading Economic Indicators
The historic drop in real liquidity (M2 money supply)
Earnings estimates remain too high and must be adjusted downward to reflect reality
Fed brings the terminal rate above market expectations and/or holds for longer than anticipated
Lagged effects from the tightening of financial conditions is worse than expected
Further escalation of geopolitical risks
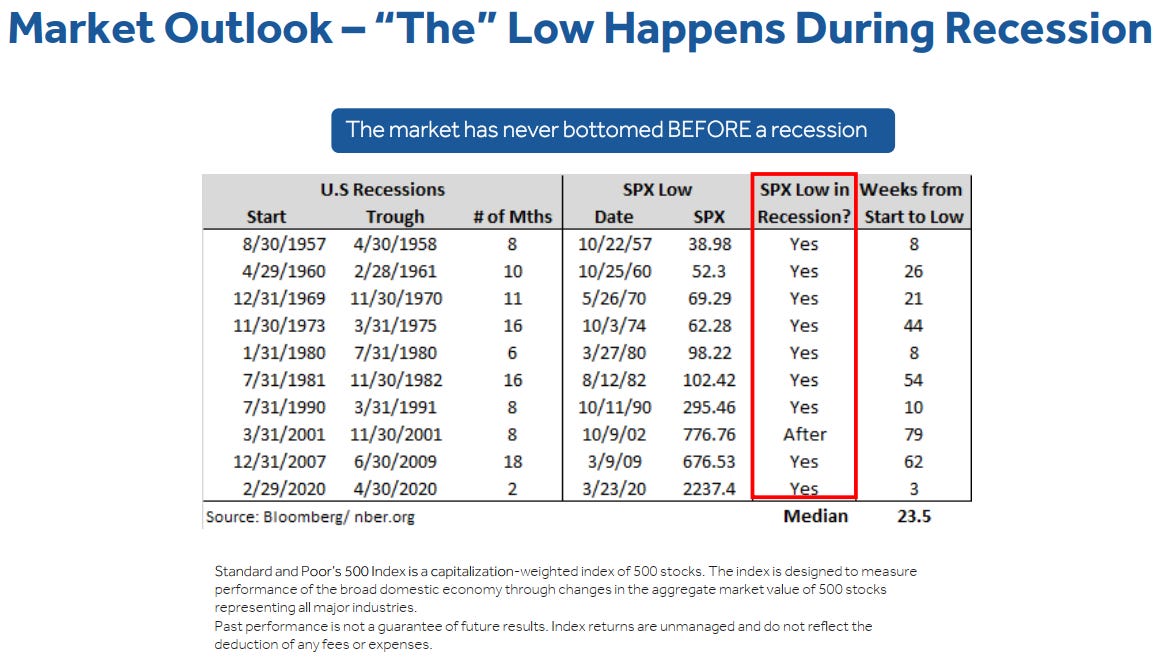
Historically, stocks do not bottom before the recession begins
Tomorrow, we will review the bull case – and outline how the U.S. economy can achieve a soft landing.
Source: Canaccord Genuity
Death by 386 rate hikes
Monetary policy tightening was the big macro theme of 2022, and it is sure to echo at least for a time into 2023. The 2022 full-year count came in at 386 rate hikes across 82 central banks (which compares to 123 rate hikes across 41 central banks in 2021).
The pace, magnitude, and breadth of rate hikes globally is unprecedented in recent years, and the impact of this normalization in policy is going to be felt increasingly this year (especially more-so for the economy, as markets have mostly reacted to the policy tightening so far e.g. both stocks and bonds falling double-digits last year).
Macro was the driver of markets in 2022 – central banks deliberately increased the cost of capital to discourage borrowing and slow the real economy. Think of things like mortgages, credit cards, auto loans, etc We shall see the effects of this tightening cycle take shape in 2023.
Source: Topdown Charts
How employment in the U.S. compares to pre-pandemic times
When the pandemic hit in full force in the 1st quarter of 2020, the U.S. economy erased nearly 20 million jobs in a matter of weeks as the global economy came to a screeching halt.
While most sectors and the economy as a whole have now recovered the jobs lost in spring of 2020, there are still some gaps in the recovery. The leisure and hospitality sector in particular is still almost a million jobs short of its February 2020 level, with the public sector also lagging behind in the jobs recovery.
While these numbers could be interpreted as continued weakness in the affected industries, they are to a large extent the result of employers’ difficulty to fill open positions. According to the latest JOLTS report, there were more than 1.5 million job openings in leisure and hospitality at the end of November, with 1.3 million unfilled positions in accommodation and food services alone. The same is true for government jobs, of which roughly 960,000 remained unfilled in November.
With total nonfarm employment exceeding the February 2020 (i.e. pre-pandemic) level by 1.2 million workers in December and job openings hovering above 10 million, the U.S. labor market remains very tight. That means labor demand outstrips supply be a significant margin despite the Fed's efforts to balance them out, which would relieve upward pressure on wages and thus cool inflation.
Source: St. Louis Fed, Statista
Bullish coil in Caterpillar
The stock market began the year showing strength in the same areas as it ended last year.
This is particularly true when evaluating the industrial – and economic – bellwether Caterpillar (CAT), as the stock closed at new all-time highs today.
Not only is CAT making new all-time highs on an absolute basis, but the stock is making fresh multi-year highs relative to the S&P 500. This kind of relative strength is solid confirming evidence for the recent price action.
The next datapoint to consider for confirmation is to see momentum achieve overbought conditions. If and when that happens, it could confirm a valid upside resolution for $CAT. This would be a very bullish development for the broader market and risk assets at large.
Source: All Star Charts
Investing ≠ Gambling
Create a pragmatic financial plan, spend less than you earn, find quality investments, and – most importantly – extend your time horizon.
Source: Compounding Quality
That’s all for today.
Blake
Welcome to The Sandbox Daily, a daily curation of relevant research at the intersection of markets, economics, and lifestyle. We are committed to delivering high-quality and timely content to help investors make sense of capital markets.
Blake Millard is the Director of Investments at Sandbox Financial Partners, a Registered Investment Advisor. All opinions expressed here are solely his opinion and do not express or reflect the opinion of Sandbox Financial Partners. This Substack channel is for informational purposes only and should not be construed as investment advice. Clients of Sandbox Financial Partners may maintain positions in the markets, indexes, corporations, and/or securities discussed within The Sandbox Daily.


