

Hedge Fund trends, plus Chinese markets, bond market repositions, Conference Board capitulates, and earnings
The Sandbox Daily (2.20.2024)

Welcome, Sandbox friends.
Today’s Daily discusses:
hedge fund trend monitor
volatility roils Chinese markets in 2024, nothing new vs. history
bond market continues to struggle with Fed policy
Conference Board capitulates, waves off recession call
mixed earnings results
Let’s dig in.
Markets in review
EQUITIES: Dow -0.17% | S&P 500 -0.60% | Nasdaq 100 -0.79% | Russell 2000 -1.41%
FIXED INCOME: Barclays Agg Bond +0.09% | High Yield +0.21% | 2yr UST 4.612% | 10yr UST 4.275%
COMMODITIES: Brent Crude -1.28% to $82.49/barrel. Gold +0.59% to $2,036.0/oz.
BITCOIN: +0.69% to $52,112
US DOLLAR INDEX: -0.21% to 104.076
CBOE EQUITY PUT/CALL RATIO: 0.53
VIX: +4.83% to 15.42
Quote of the day
“A technician is a fundamentalist who has endured a bear market without stops.”
- Jeff Weiss on The Morning Show
Hedge fund trend monitor
The Goldman Sachs U.S. Portfolio strategy team published their Hedge Fund Trend Monitor quarterly report, which analyzed 722 hedge funds with $2.6 trillion of gross equity positions ($1.7T long and $890B short). The broad takeaways?
Positioning: Hedge fund leverage has rebounded alongside the equity market. With popular longs and shorts successfully generating alpha, hedge fund gross exposures have continued to register new record highs. Hedge fund net exposure remains far below the record highs of mid-2021 but has rebounded from multi-year lows as managers adjust their risk appetite. Both gross and net exposures are currently registering at the 99% percentile over the trailing 12-months.

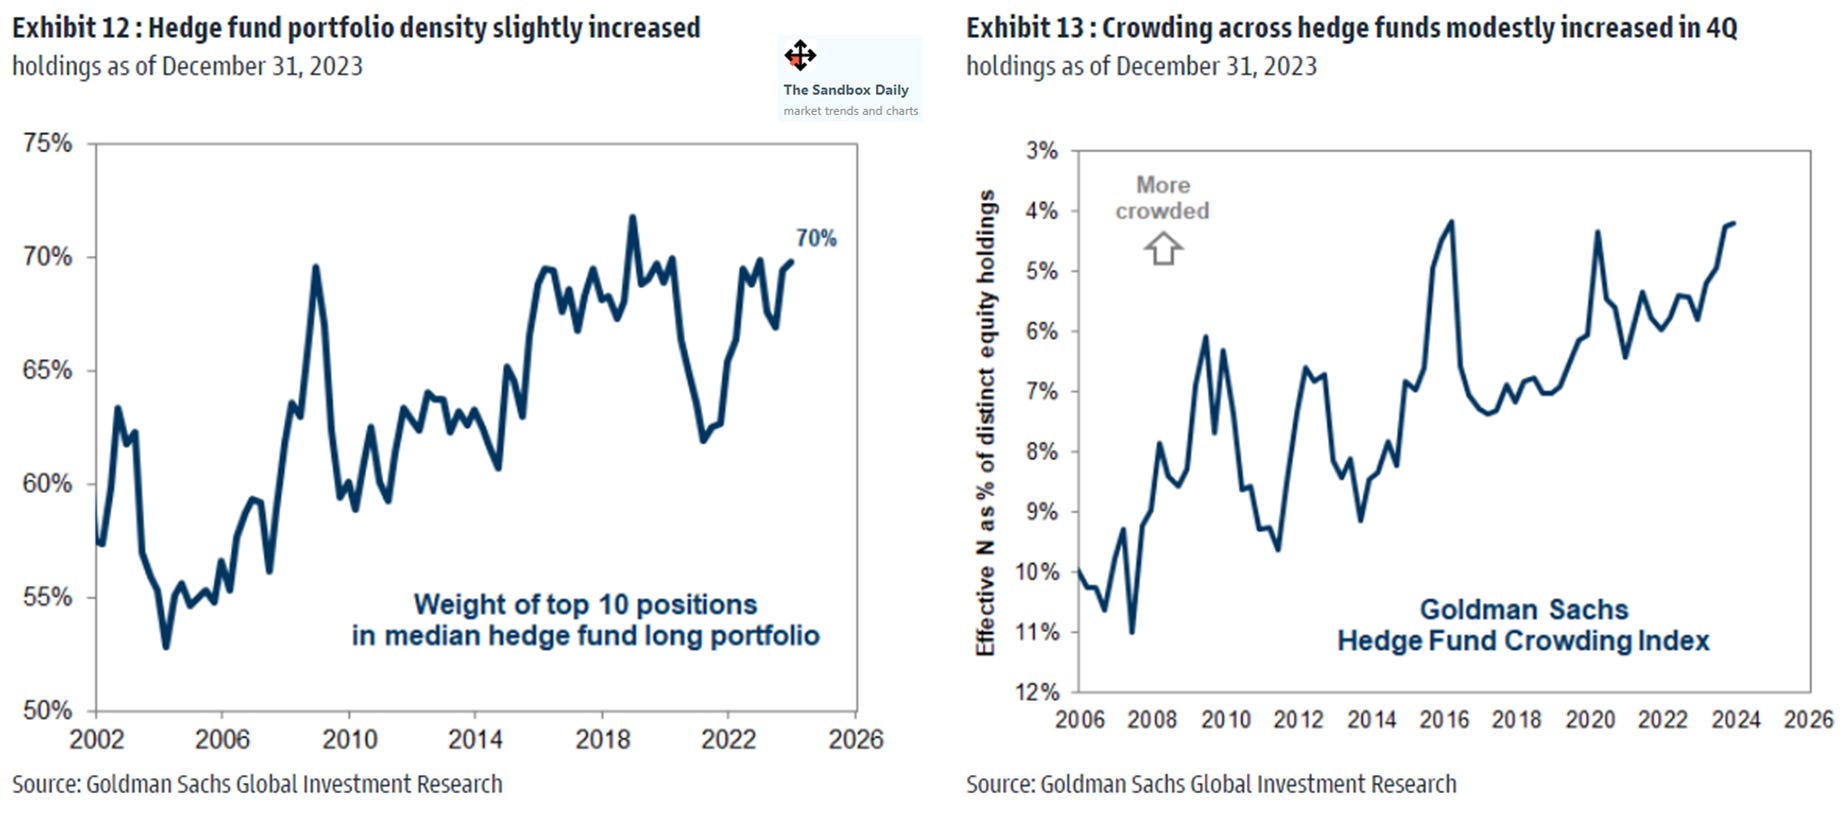
Concentrating/crowding positions: Concentration within the typical hedge fund portfolio and crowding across portfolios both increased during Q4. The typical hedge fund holds 70% of its long portfolio in its top 10 positions, matching the highest concentration on record outside of 4Q18 – see chart below, bottom left. Meanwhile, the Goldman Sachs Hedge Fund Crowding Index – a proprietary metric tracking overlap of positions across portfolios – registered the most crowding across hedge fund long portfolios in their 22-year data history – see chart below, bottom right.


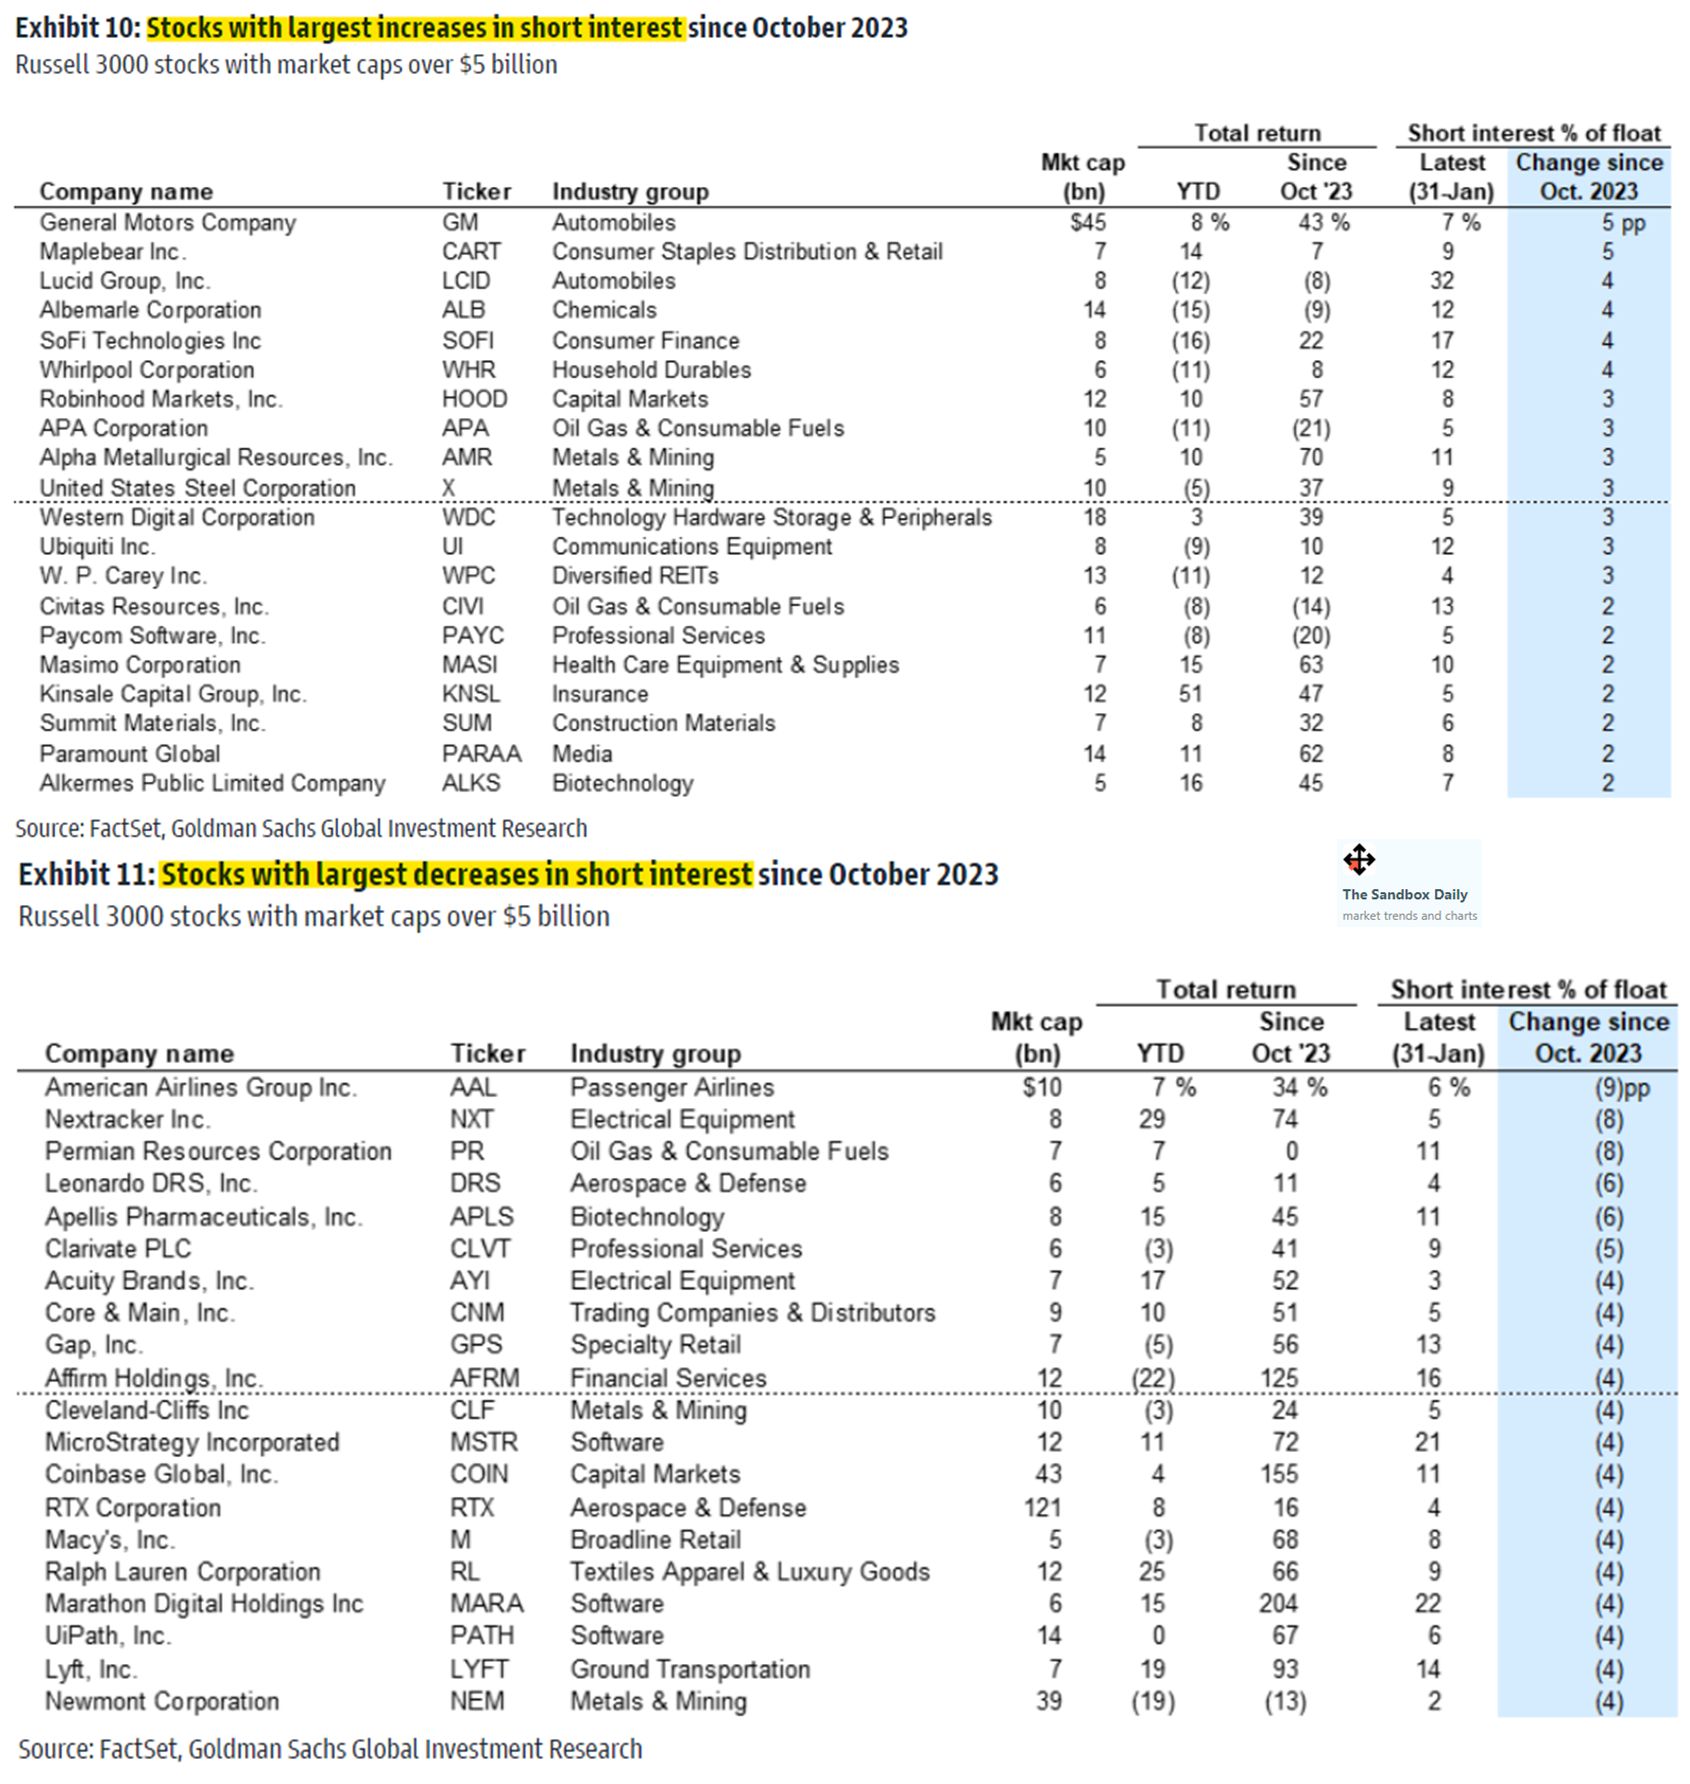
Short Interest: Because hedge funds have the ability to outright short stocks in the way a traditional mutual fund or ETF cannot, it’s always interesting to review the stocks with the largest changes (up or down) in short interest. As short squeezes have become more problematic for hedge fund managers, funds are increasingly using ETFs and derivatives as opposed to individual names.

Source: Goldman Sachs Global Investment Research
Volatility roils Chinese markets in 2024
Investing in Chinese equities is not for the faint of heart.
Over the last 30 years, the MSCI China index has averaged an intra-year drawdown of -30.3%, roughly double what investors have faced in the S&P 500.

Having already suffered a >10% drawdown early in 2024, Chinese stocks are struggling for traction as its economy grapples with a property slump, stubborn deflation, and an aging workforce.
Over the last few weeks, Chinese leaders have implemented a variety of policy measures to curb the selling pressures that have caused ~$7T in stock market losses. The latest announcement came today when the PBOC cut the 5-year loan prime rate by 25 bps to 3.95%, its largest cut ever – this is their benchmark for home loans.

Source: Strategas Asset Management, Bloomberg
Bond market continues to struggle with Fed policy
In five weeks, the bond market has repositioned itself from expecting 7 Fed cuts to just 3 in 2024.

Source: Jim Bianco
Leading Economic Indicators (LEI) index finally capitulates: no longer forecasting recession
The Conference Board’s Leading Economic Indicators (LEI) index continued its decline in January, dropping -0.4% month-over-month (MoM).
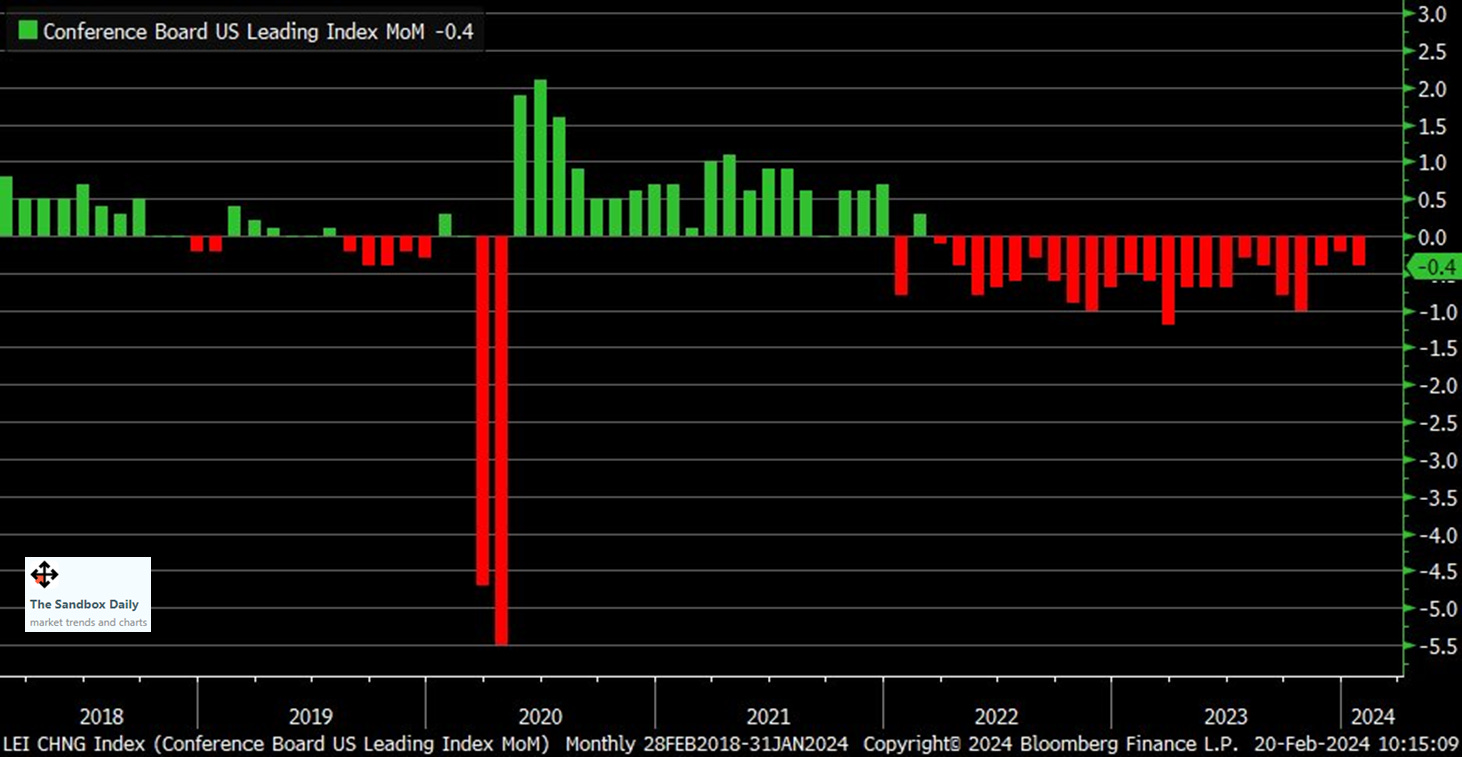
This report marked its 23rd consecutive decline which makes it the longest such stretch since March 2009 during the end of the Global Financial Crisis.

But, what caught most people’s attention today?
The Conference Board no longer forecasts a recession in 2024, although they expect growth to weaken substantially to “near 0% over Q2 and Q3.” This is a start departure from the Conference Board’s messaging over the past year/year-and-a-half.

The Conference Board publishes leading, coincident, and lagging indexes designed to signal peaks and troughs in the business cycle for major global economies.
Many economists and investors track this measure closely. While no forecasting system is perfect, this one has a very good track record.
Source: The Conference Board, Liz Ann Sonders, Ned Davis Research, Advisor Perspectives
Mixed earnings results
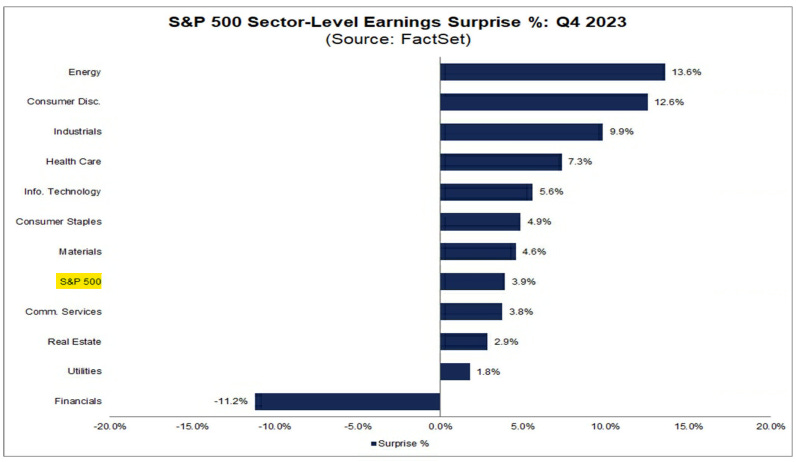
With 79% of the S&P 500 having reported results, the overall performance of 2023 4th quarter earnings at this point can best be described as mixed.
The good news is the nearly-completed earnings season highlighted the ability of corporations to sustain profit margins despite slowing inflation. The bad news is the “Magnificent 7” basket of stocks did the majority of the heavy lifting; while the Mag 7 printed YoY earnings growth of 58%, the remaining 493 stocks in the S&P 500 saw earnings fall by 2%.
To date, 75% of reporting companies have produced actual earnings above estimates, which is just slightly above the 10-year average of 74%.

Yet, the magnitude by which companies are beating their estimates is only +3.9%, which is well below the 10-year average of +6.7%.
The blended earnings growth rate – combining actual results for companies that have reported and estimated results for those that haven’t – for the S&P 500 during the 4th quarter is +3.2%, which is not exactly a blistering pace but would mark the 2nd consecutive quarter of positive earnings growth.

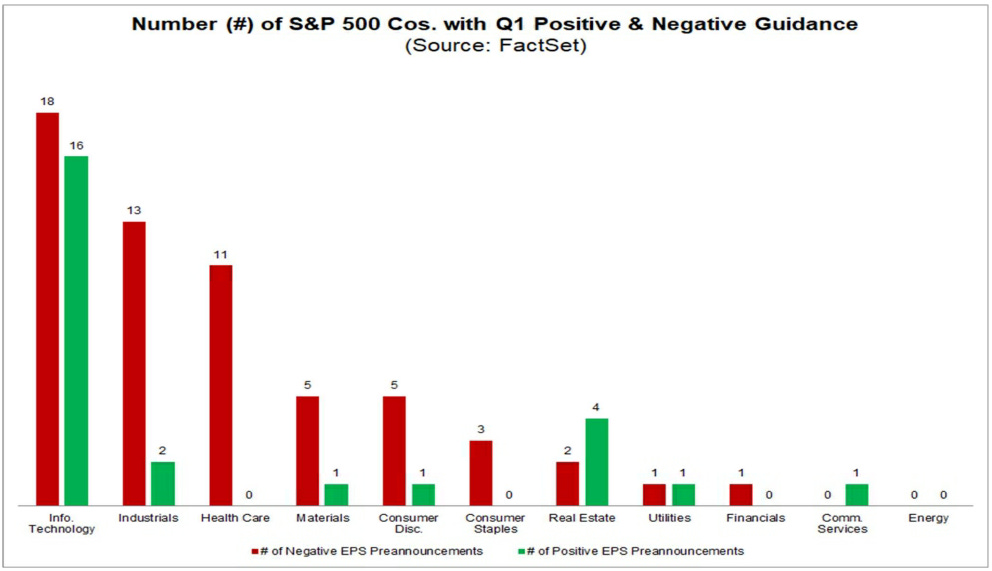
Of the 85 companies in the index that have issued EPS guidance for Q1 in 2024, 59 have issued negative EPS guidance (red bars below) and 26 have issued positive EPS guidance (green bars). The percentage of companies issuing negative EPS guidance for Q1 2024 is 69% (59 out of 85), which is above the 10-year average of 63%.
As for what’s next?
Analysts are projecting the S&P 500 will grow EPS by 10.9% in 2024 and 13% in 2025 – these are lofty estimates that many have questioned if the market can prove its mettle. A more dovish Fed/monetary policy, lower real interest rates, and upgraded outlooks for U.S. economic growth are all cited as contributing factors towards earnings expansion which will be needed to support the multiple expansion we witnessed in 2023.

Source: FactSet, Yahoo Finance, Fundstrat, Goldman Sachs Global Investment Research
That’s all for today.
Blake
Welcome to The Sandbox Daily, a daily curation of relevant research at the intersection of markets, economics, and lifestyle. We are committed to delivering high-quality and timely content to help investors make sense of capital markets.
Blake Millard is the Director of Investments at Sandbox Financial Partners, a Registered Investment Advisor. All opinions expressed here are solely his opinion and do not express or reflect the opinion of Sandbox Financial Partners. This Substack channel is for informational purposes only and should not be construed as investment advice. The information and opinions provided within should not be taken as specific advice on the merits of any investment decision by the reader. Investors should conduct their own due diligence regarding the prospects of any security discussed herein based on such investors’ own review of publicly available information. Clients of Sandbox Financial Partners may maintain positions in the markets, indexes, corporations, and/or securities discussed within The Sandbox Daily. Any projections, market outlooks, or estimates stated here are forward looking statements and are inherently unreliable; they are based upon certain assumptions and should not be construed to be indicative of the actual events that will occur.