

High levels of risk appetite might create “speed limit” for return
The Sandbox Daily (1.27.2026)

Welcome, Sandbox friends.
Today’s Daily discusses:
high levels of risk appetite might create “speed limit” for returns
Let’s dig in.
Blake
Markets in review
EQUITIES: Nasdaq 100 +0.88% | S&P 500 +0.41% | Russell 2000 +0.26% | Dow -0.83%
FIXED INCOME: Barclays Agg Bond -0.07% | High Yield -0.01% | 2yr UST 3.573% | 10yr UST 4.239%
COMMODITIES: Brent Crude +2.99% to $67.55/barrel. Gold +1.81% to $5,214.8/oz.
BITCOIN: +1.97% to $89,157
US DOLLAR INDEX: -1.26% to 95.815
CBOE TOTAL PUT/CALL RATIO: 0.96
VIX: +1.24% to 16.35
Quote of the day
“To be yourself in a world that is constantly trying to make you something else is the greatest accomplishment.”
- Ralph Waldo Emerson
High levels of risk appetite might create “speed limit” for returns
If 2026 feels like a year where every week brings a new macro or geopolitical landmine – aka “headline roulette” – then investor behavior hasn’t shown it. Positioning and flows suggest risk appetite remains not just intact but elevated.
Risk appetite indicators across the street sit firmly in bullish territory, with flows into risky assets continuing to run positive – underscoring how comfortable investors remain leaning into risk even as uncertainty dominates the tape.
The proprietary Goldman Sachs Risk Appetite Indicator Index (GSRAII) reached its highest level (1.09) since 2021, triggering a reading in the 98th percentile dating back 35 years in this data set. This proprietary model aggregates 27 risk premia and procyclical pair trades across multiple asset classes to disentangle and quantify the macro drivers of risk appetite.
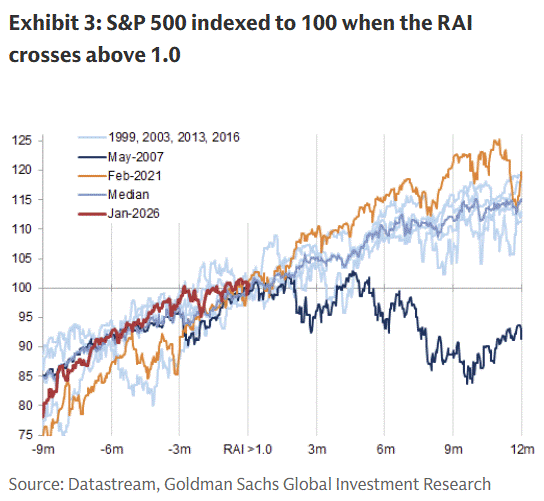
As the RAI score approaches 1 or more (i.e. very bullish levels) – as you can see in Exhibit 1 below – it can often indicate more muted returns ahead and/or a higher chance of a near-term pullback.
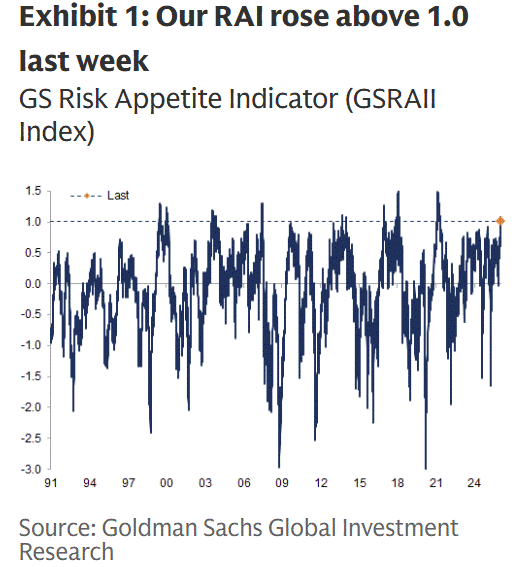
As Goldman notes: “Such elevated levels of risk appetite are rare—there were only 6 instances when the RAI went above 1.0 since 1991, making it more difficult to extrapolate historical patterns. That said, in most episodes equities delivered positive returns in the subsequent 12 months, but returns slowed down after about 6 months.”
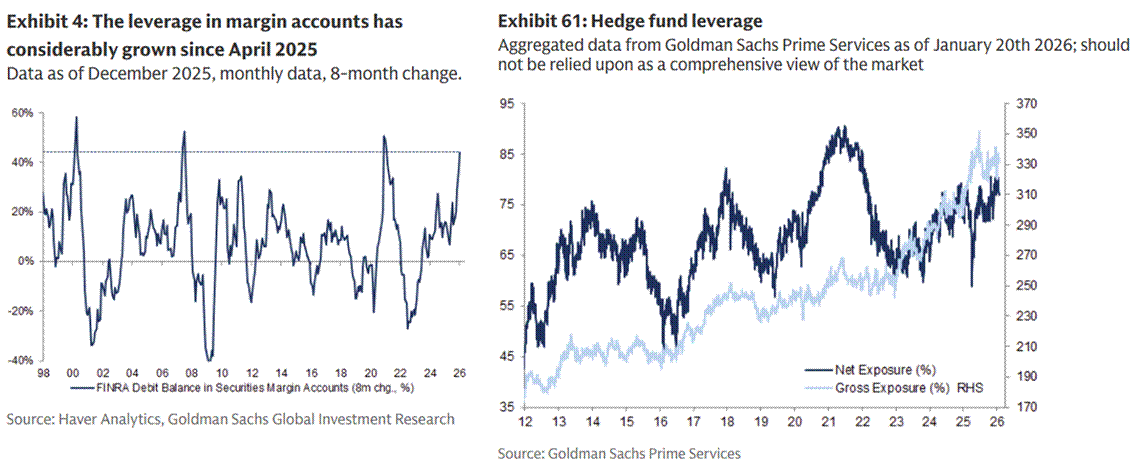
Market participants – from retail to hedge funds – continue to position themselves bullishly.
While leverage measures have only picked up modestly in recent weeks, the absolute levels show leverage is pushing the upper boundary of recent history and approaching prior cycle peaks.
Importantly, the growing leverage feels less reckless and more incremental on the margin, consistent with a maturing risk cycle rather than a speculative blow-off top.
Equity exposure remains broad and well-supported. Asset manager equity positioning is elevated, retail investors are increasingly buying beyond the Mag7, and CTA betas have turned more positive to both equities and commodities.
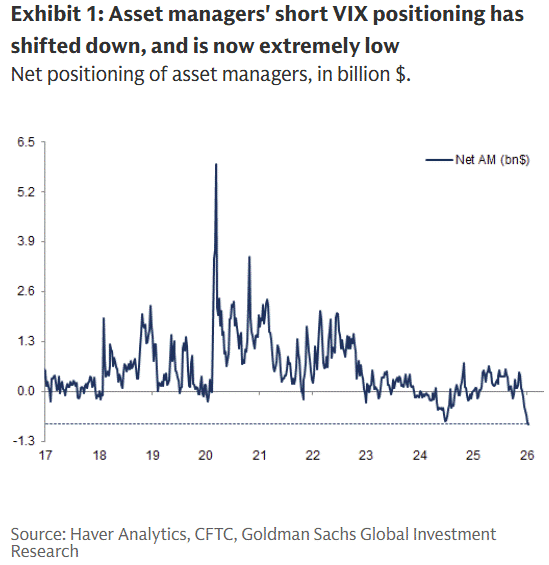
Volatility positioning tells a similar story: asset managers are running the largest net short VIX exposure of the past decade, a clear signal of confidence in near-term market stability.
Alongside these data points, various sentiment surveys had drifted into happy territory. See exhibit A, the mid-January survey reading from the American Association of Individual Investors (AAII) which was the most bullish since November of 2024.
To be clear, none of these are a reason to run for the hills, but collectively, they contribute to a tactical setup where there’s less room for error and increase the risk of a near-term downside air pocket.
Sources: Goldman Sachs Global Investment Research, American Association of Individual Investors
That’s all for today.
Blake
Questions about your financial goals or future?
Connect with a Sandbox financial advisor – our team is here to support you every step of the way!
Welcome to The Sandbox Daily, a daily curation of relevant research at the intersection of markets, economics, and lifestyle. We are committed to delivering high-quality and timely content to help investors make sense of capital markets.
Blake Millard is the Director of Investments at Sandbox Financial Partners, a Registered Investment Advisor. All opinions expressed here are solely his opinion and do not express or reflect the opinion of Sandbox Financial Partners. This Substack channel is for informational purposes only and should not be construed as investment advice. The information and opinions provided within should not be taken as specific advice on the merits of any investment decision by the reader. Investors should conduct their own due diligence regarding the prospects of any security discussed herein based on such investors’ own review of publicly available information. Clients of Sandbox Financial Partners may maintain positions in the markets, indexes, corporations, and/or securities discussed within The Sandbox Daily. Any projections, market outlooks, or estimates stated here are forward looking statements and are inherently unreliable; they are based upon certain assumptions and should not be construed to be indicative of the actual events that will occur.
Please see additional disclosures (click here)
Please see our SEC Registered firm brochure (click here)
Please see our SEC Registered Form CRS (click here)
The 98th percentile reading on Goldman's RAI is striking when paired with asset managers' record short VIX positioning. It's the classic "everyone's leaning the same way" setup. What I find most telling isn't the absolute level of confidence but how quickly it rebuilt after recent volatilty spikes. The historical pattern of muted returns 6 months after RAI crosses 1.0 suggests positioning itself becomes the risk, not necessarily fundamentals deteriorating.