

Historical context of current bull run, plus the expensive market multiple and the Fed's easing bias
The Sandbox Daily (12.9.2024)

Welcome, Sandbox friends.
Today’s Daily discusses:
historical context of current bull run
yes, the market is expensive
Fed is in easing mode
Let’s dig in.
Blake
Markets in review
EQUITIES: Dow -0.54% | S&P 500 -0.61% | Russell 2000 -0.67% | Nasdaq 100 -0.84%
FIXED INCOME: Barclays Agg Bond -0.29% | High Yield -0.13% | 2yr UST 4.127% | 10yr UST 4.203%
COMMODITIES: Brent Crude +1.17% to $71.95/barrel. Gold +0.84% to $2,681.9/oz.
BITCOIN: -3.21% to $97,403
US DOLLAR INDEX: +0.11% to 106.172
CBOE TOTAL PUT/CALL RATIO: 0.84
VIX: +11.12% to 14.19
Quote of the day
“When you believe in a thing, believe in it all the way, implicitly and unquestionable.”
- Walt Disney
Historical context of current bull run
The old Wall Street adage “markets climb a wall of worry" sums up the narrative of this market quite well.
Equity markets have managed to maintain a steady upward path despite a series of roadblocks, some of which include rising interest rates, an upward inflationary spiral, geopolitics, and recession.
As this bull run is early in year three off the October 2022 lows, the path forward shows risks are tilted to the upside given the context of well-telegraphed monetary policy from central banks around the world, lower borrowing costs, and an expansion in the corporate earnings cycle.
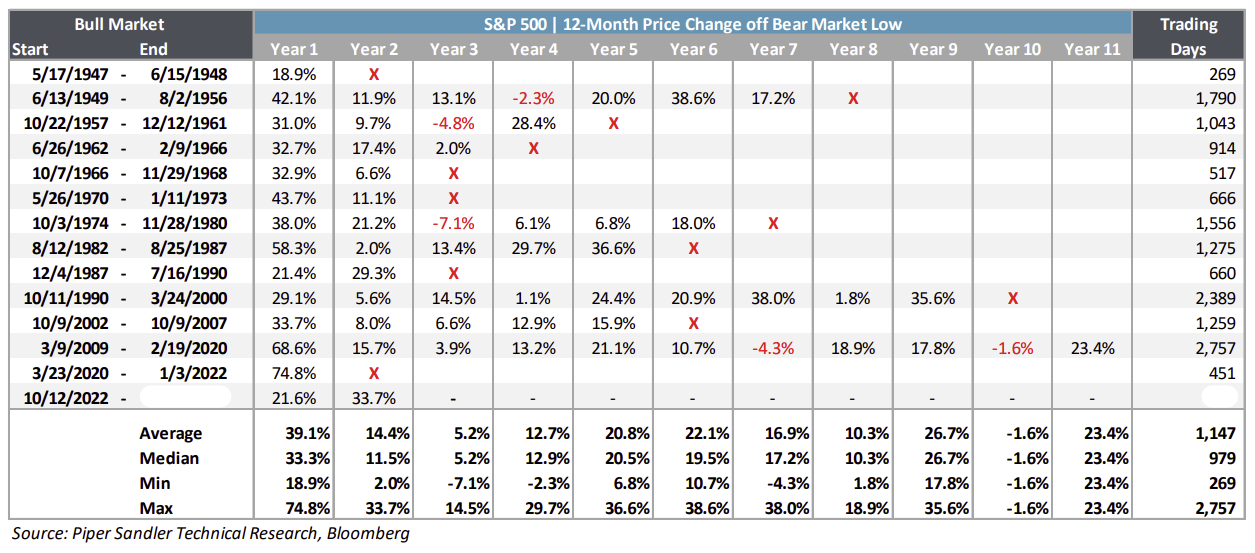
Historically, advances off bull market cyclical lows have an average duration of 1,147 trading days. Today, the current bull is just 539 trading days old – less than half the average advance post-World War II.
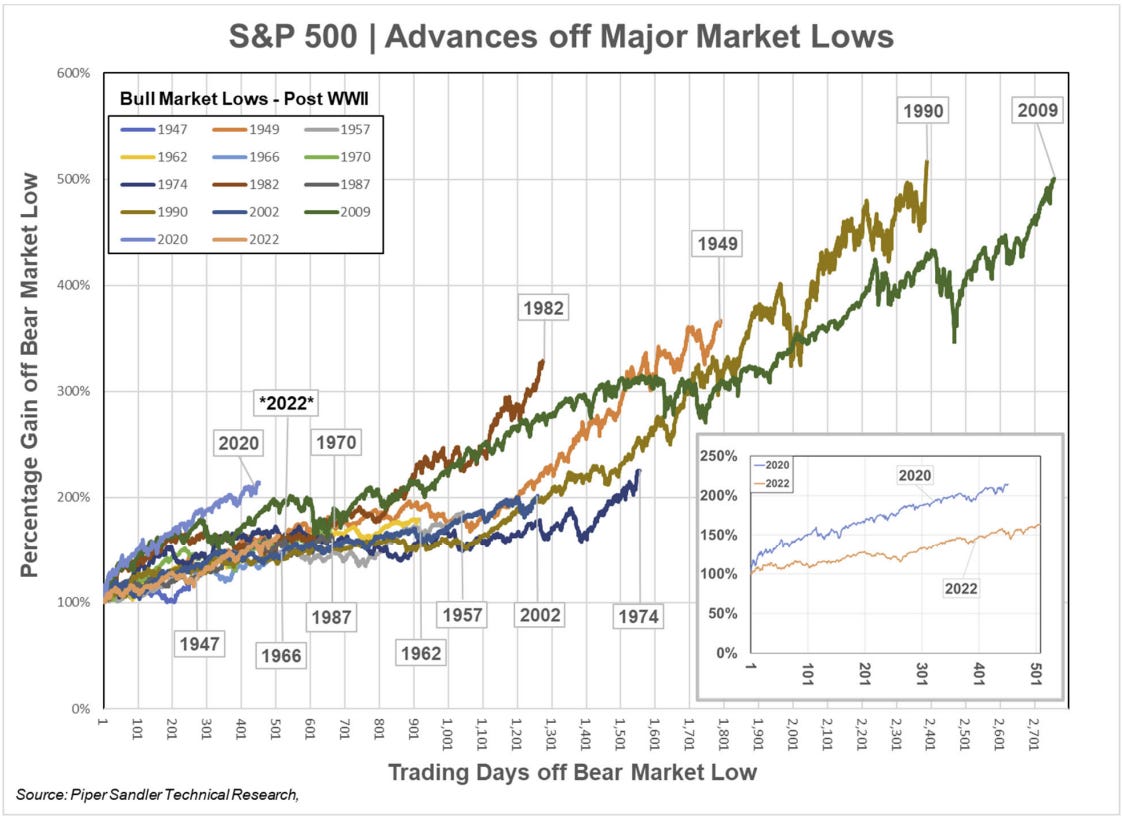
Historically, the strongest years of any bull market have been the first and last years, should they last longer than three years.
The table below highlights the percentage change for each year of a bull market advance post-World War II.
Source: Piper Sandler
The market is expensive
As the forward S&P 500 multiple exceeds 22x (~1.5 standard deviations expensive), future public equity returns become a bit more of a challenge.
The scattergram below provides a visual representation of the relationship between the market multiple and future returns over the next 12 months and 5 years. The downward sloping line is the linear regression, or line of best fit, showing higher P/Es are associated with lower subsequent returns than lower P/E ratios.
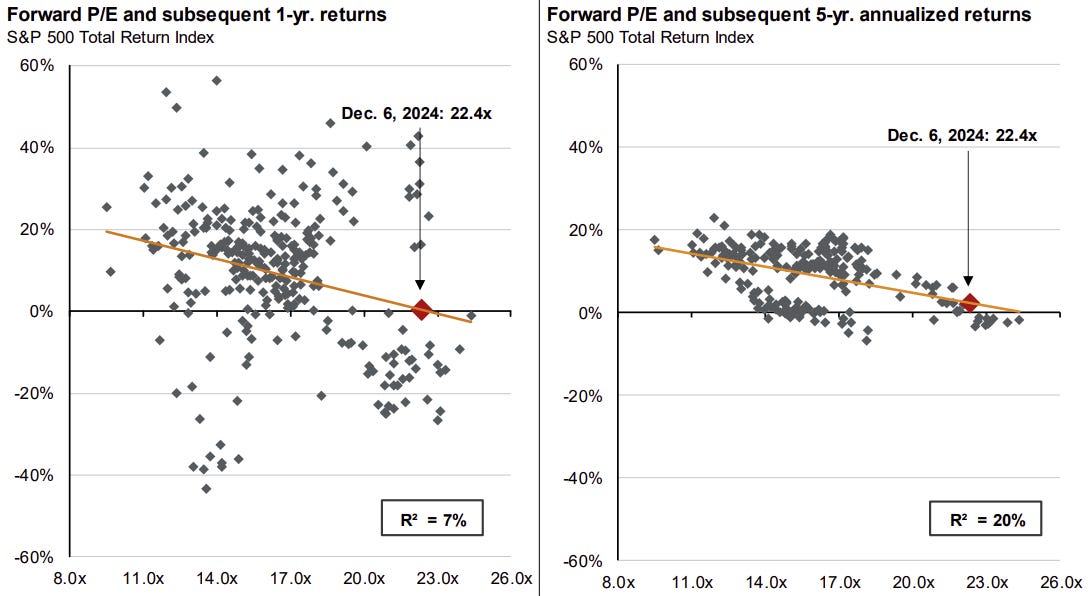
As you can see, market valuations do not impact/explain much about forward market returns over shorter time horizons, but over longer time frames, valuation matters.
Historically, more lofty valuations – i.e. higher P/E multiples – have led to market underperformance.
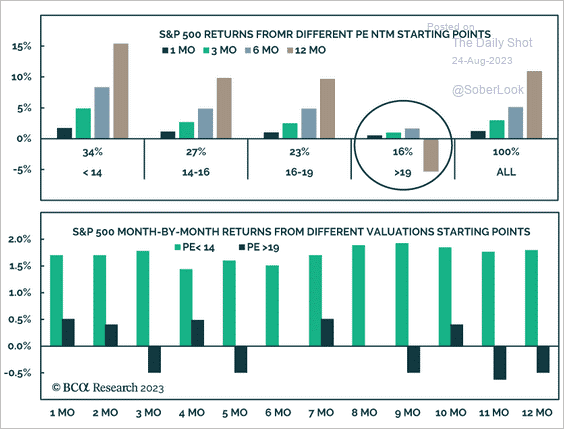
After two years of a blistering rally, the relentless pace of market gains has some investors worried about a customary 3-5% pullback, or as much as a 10% correction, given these soaring valuations could make the broader market vulnerable to a sudden pullback.
The major caveat here is that valuation is a terrible timing tool, as stocks tend to move above or below fair value regularly and can stay overbought/oversold for long periods of time.
Source: J.P. Morgan Guide to the Markets, The Daily Shot
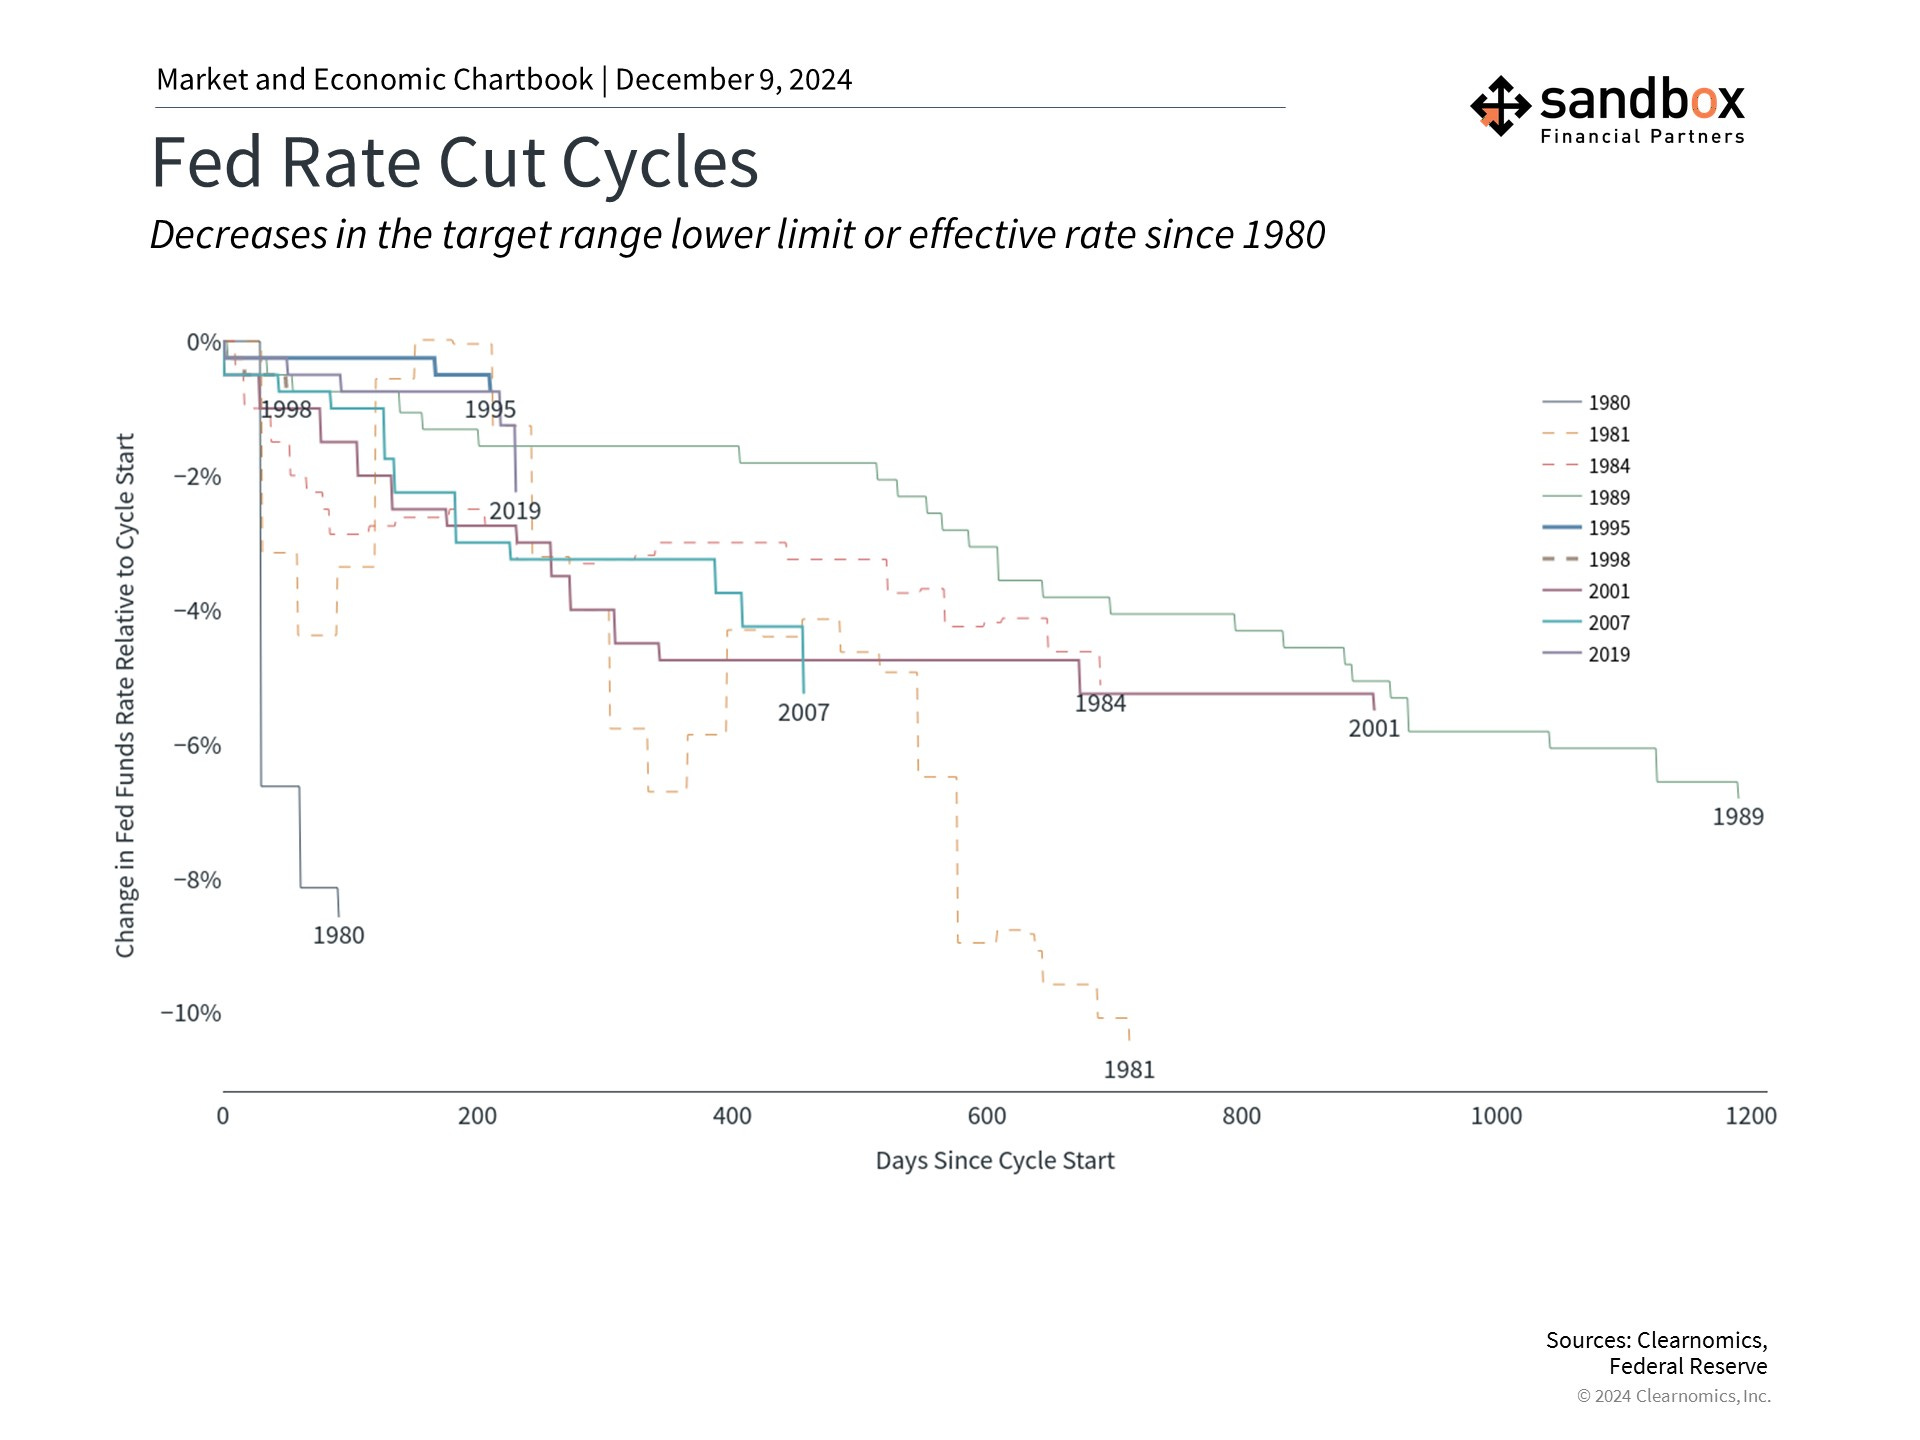
Reminder, the Fed is easing policy
The Fed began to cut its policy rate back in September after months of investor speculation. So far, the Fed has lowered rates by 0.75%, with markets expecting three or four more 25bps cuts additionally by the end of 2025.
The timing and magnitude of these rate cuts remain uncertain and will depend on the economic data. Regardless, the monetary policy headwinds that began in 2022 are now turning into tailwinds. Just as higher rates slowed economic growth and led to investor concerns, lower rates can help to stimulate the economy, supporting both corporate earnings and possibly stock market returns in the long run.
After a few challenging years, the easing of monetary policy may also be positive for bonds as inflation and economic growth potentially enter a more stable period. If short-term rates trend lower and longer-term rates remain steady, the prices of many bonds could benefit while still offering attractive yields. This environment may present opportunities for diversified investors to generate both income and growth.
For investors, what matters is not trying to guess each move by the Fed, but the overall path of rates.
With greater clarity and guidance around Fed policy, the market’s attention may shift back to specific policies by the incoming Trump administration.
Source: Clearnomics
That’s all for today.
Blake
Questions about your financial goals or future?
Connect with a Sandbox financial advisor – our team is here to support you every step of the way!
Welcome to The Sandbox Daily, a daily curation of relevant research at the intersection of markets, economics, and lifestyle. We are committed to delivering high-quality and timely content to help investors make sense of capital markets.
Blake Millard is the Director of Investments at Sandbox Financial Partners, a Registered Investment Advisor. All opinions expressed here are solely his opinion and do not express or reflect the opinion of Sandbox Financial Partners. This Substack channel is for informational purposes only and should not be construed as investment advice. The information and opinions provided within should not be taken as specific advice on the merits of any investment decision by the reader. Investors should conduct their own due diligence regarding the prospects of any security discussed herein based on such investors’ own review of publicly available information. Clients of Sandbox Financial Partners may maintain positions in the markets, indexes, corporations, and/or securities discussed within The Sandbox Daily. Any projections, market outlooks, or estimates stated here are forward looking statements and are inherently unreliable; they are based upon certain assumptions and should not be construed to be indicative of the actual events that will occur.
Please see additional disclosures at the Sandbox Financial Partners website: