How to reach $1 million dollars by 65, plus household balance sheets, Japan ATHs, quality, and equity volatility
The Sandbox Daily (2.22.2024)
Welcome, Sandbox friends.
Today’s Daily discusses:
monthly savings rates to reach $1M at 65 yrs old
household balance sheets better than perception
Japan's stock market hits record high
quality still matters
where’s the downside volatility?
Let’s dig in.
Markets in review
EQUITIES: Nasdaq 100 +3.01% | S&P 500 +2.11% | Dow +1.18% | Russell 2000 +0.96%
FIXED INCOME: Barclays Agg Bond +0.08% | High Yield +0.48% | 2yr UST 4.712% | 10yr UST 4.323%
COMMODITIES: Brent Crude +0.61% to $83.54/barrel. Gold +0.02% to $2,034.7/oz.
BITCOIN: +1.08% to $51,639
US DOLLAR INDEX: -0.05% to 103.959
CBOE EQUITY PUT/CALL RATIO: 0.72
VIX: -5.22 % to 14.54
Quote of the day
“Quantitatively-based solutions and asset allocation equations invariably fail as they are designed to capture what would have worked in the previous cycle whereas the next one remains a riddle wrapped in an enigma.”
- Barton Biggs, Founder of the Research Department at Morgan Stanley
Saving trumps all else
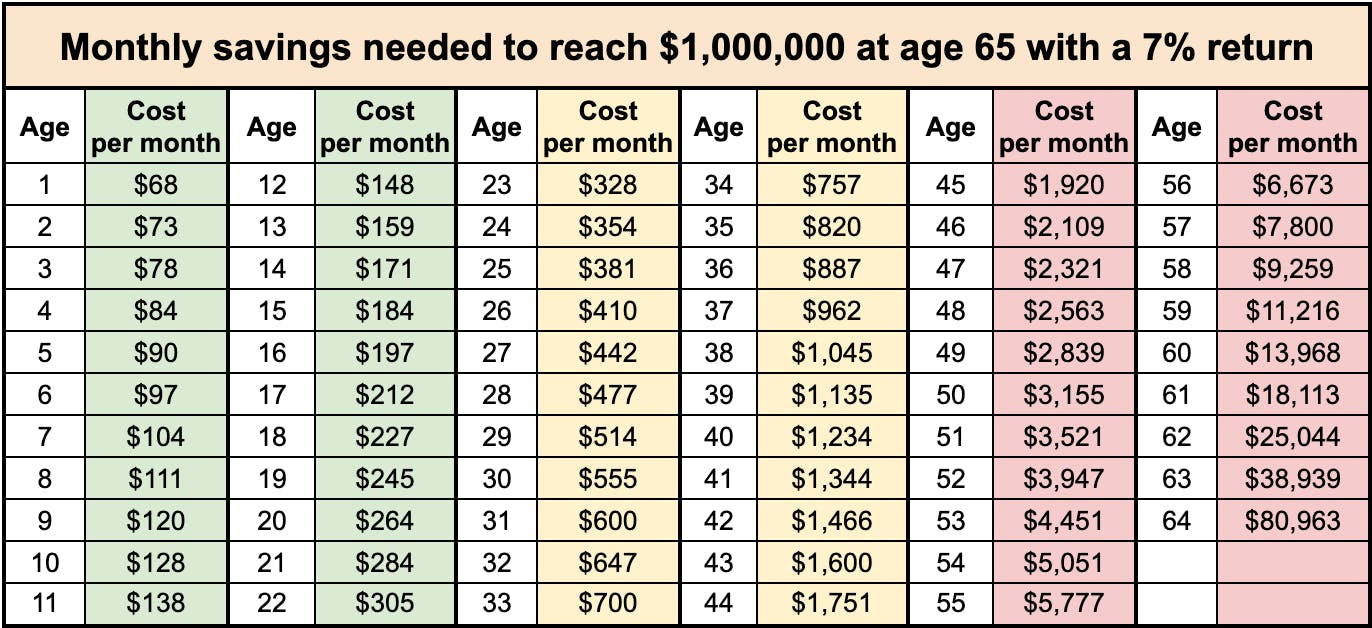
The table below shows you the monthly savings rate by age that’s required to reach $1,000,000 at age 65, assuming a 7% portfolio return.
What’s the lesson here?
Save early AND save often.
Time and compounding will do the rest.
Obviously, life – or investing for that matter – doesn’t work out in a straight line wrapped with a big red bow. However, understanding the basic concept of compounding is one of the most powerful personal finance insights one can ever learn.
Source: Brian Feroldi
Household balance sheets better than perception
The mainstream narrative in the last 2 years has expressed concern over the “tired” consumer that is struggling to keep up with inflation.
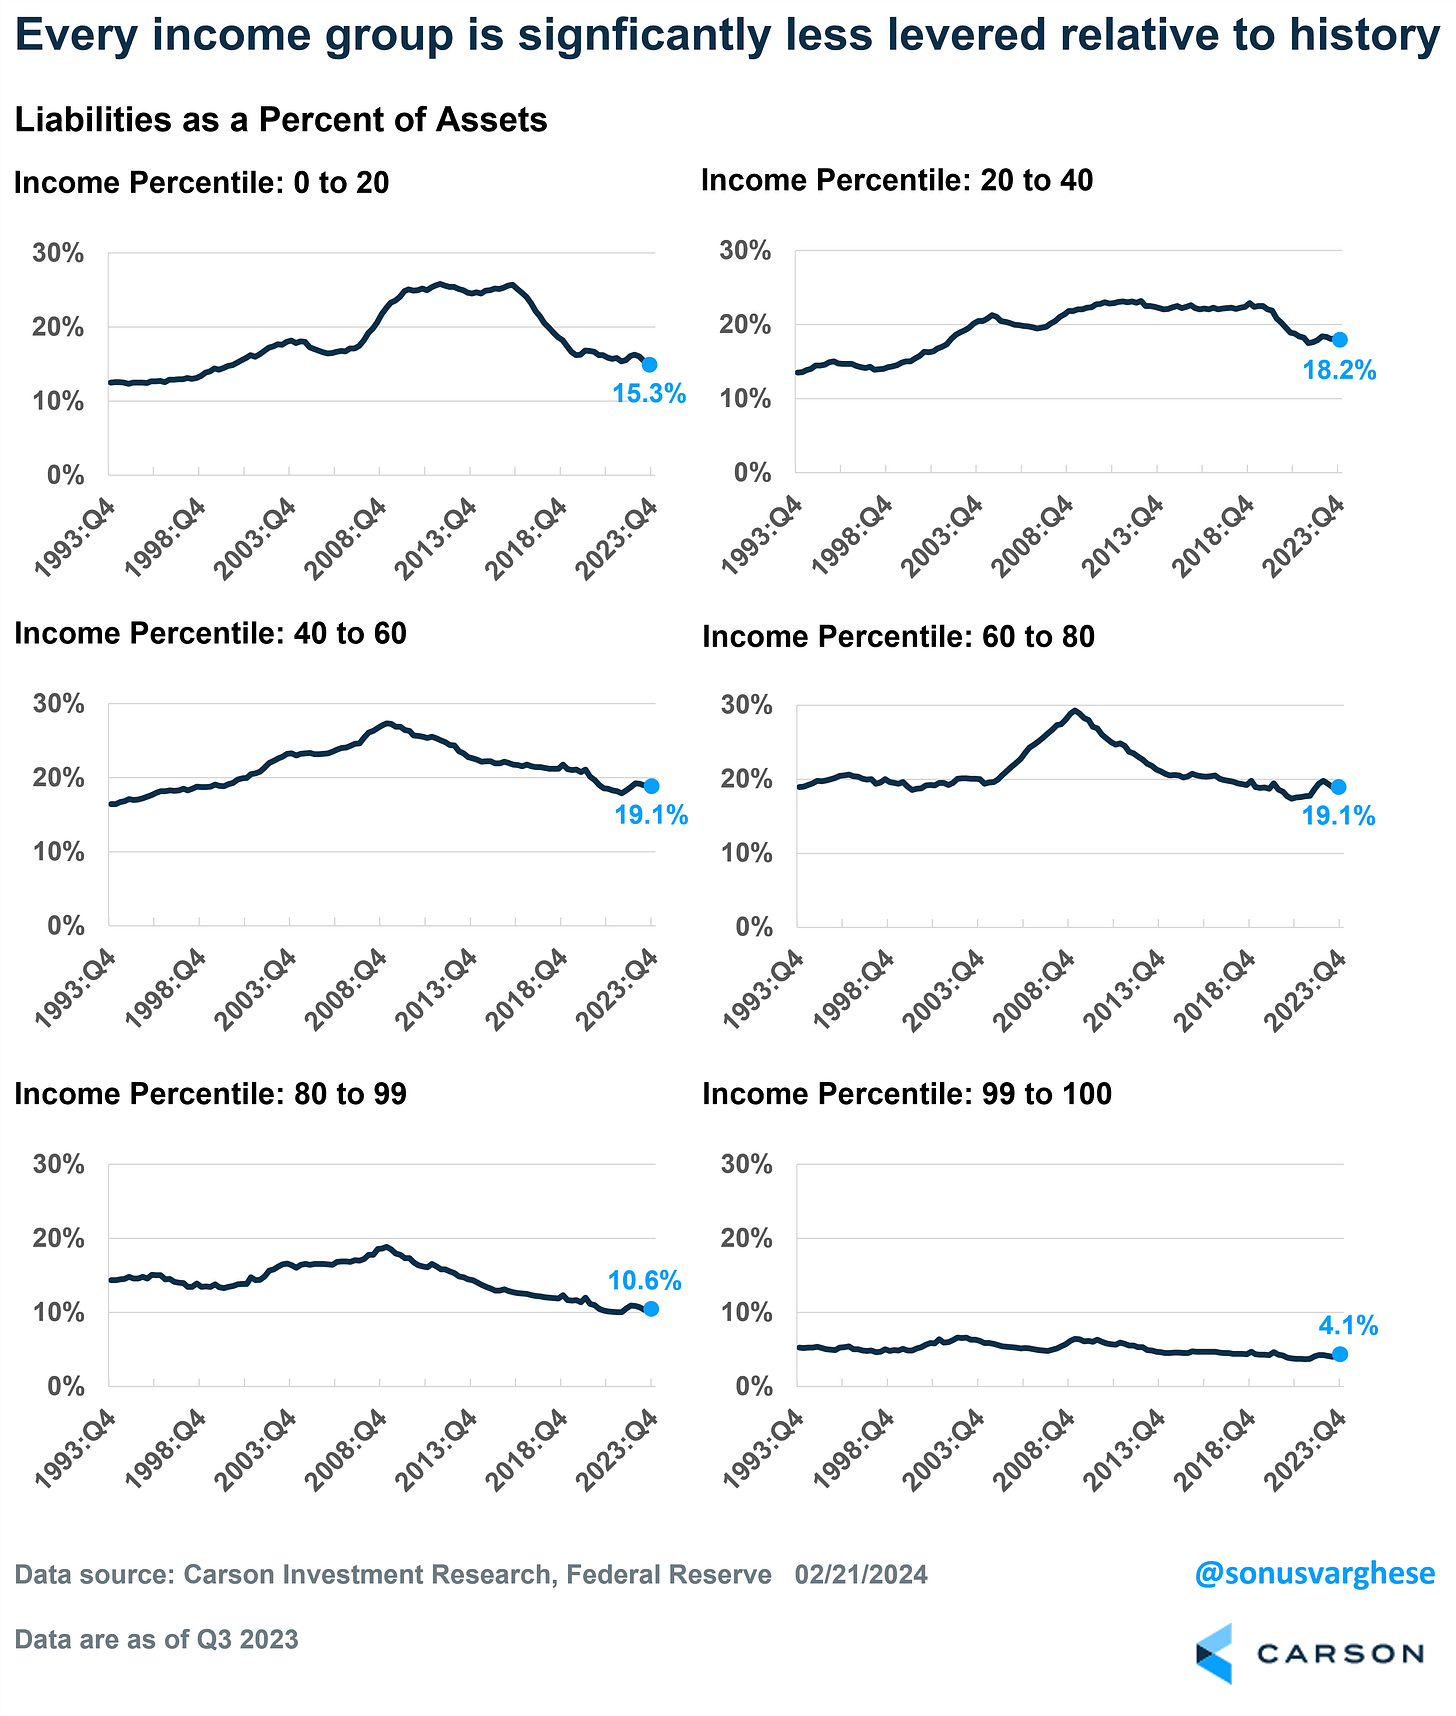
While there remain many data points to support and refute that claim, here’s one measure tracking this development that is irrefutable: household leverage ratios, or the measure of liabilities as a percentage of assets, are lower today than recent years.
The results below show a decrease in this ratio across all income groups from 4Q19 to 3Q23, except a small increase for the upper-middle income group in the 60-80th quintile.
Improvement gains seem to have been achieved on both sides of the ledger: assets are up (savings from pandemic stimulus checks, rising home prices, higher investment values), while liabilities are down (debt paydowns, low long-term fixed-rate debt).
Source: Sonu Varghese (Carson Group)
Japan's stock market hits record high
Finally!
Japan's stock market has finally reclaimed the high-water market set before its asset bubble burst in the early 1990s.
The Nikkei 225 closed at a new record high of 39,098.68 today, topping the previous all-time closing high back on December 29, 1989.
The collapse of the Nikkei coincided with the Japanese economy sinking into a deflationary funk, known as the "lost decade," that extended well beyond the 90’s. After peaking in 1995, Japan's GDP didn't reach that level again until 2010.
The recent surge for the Nikkei has been supercharged by the AI gold rush, with large Japanese exporters of semiconductor equipment soaring over the last year.
From a technical perspective, where the Nikkei goes from here is anyone’s guess.
Many traders debate if there is price memory that exists at these levels, implying overhead supply may emerge from buyers 25 years ago that could act as near-term resistance. Regardless of the near-term outlook, this pattern formation is one of the most significant and longest-forming bases in all of history. As traders often like to quip, “the bigger the base, the higher in space!”
In other news, Japan slipped into a technical recession at the end of 2023 – following two consecutive quarters of negative GDP growth. It is worth noting that Japan’s economy contracts quite often; Japan’s economy has contracted at least one quarter per year in 17 of the past 18 years.
Source: Ned Davis Research, Liz Young
Quality still matters
Small-cap indices continue to lag their larger-cap counterparts. This underperformance has frustrated many small-cap investors and also has many all-cap investors wondering if small-cap outperformance is due.
One reason for all this debate? Small-caps are more cyclical and lower in quality.
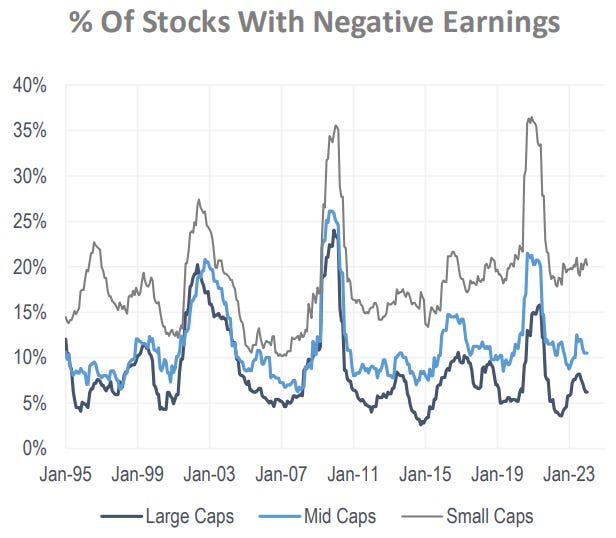
On that latter point, it’s helpful to remember that large-caps have a greater % of stocks that earn a profit vs. mid-caps, while mid-caps have a greater % of stocks that earn a profit vs. small-caps.
Leadership and outperformance this cycle has really been a story of profitability.
Source: Piper Sandler
One simple chart
We have gone 78 straight trading session without an S&P 500 pullback exceeding 2%.
The volatility compression we saw in 2023 continues in 2024.
Perfectly normal behavior for an early bull that’s expanding.
Source: Bespoke Investment Group
That’s all for today.
Blake
Welcome to The Sandbox Daily, a daily curation of relevant research at the intersection of markets, economics, and lifestyle. We are committed to delivering high-quality and timely content to help investors make sense of capital markets.
Blake Millard is the Director of Investments at Sandbox Financial Partners, a Registered Investment Advisor. All opinions expressed here are solely his opinion and do not express or reflect the opinion of Sandbox Financial Partners. This Substack channel is for informational purposes only and should not be construed as investment advice. The information and opinions provided within should not be taken as specific advice on the merits of any investment decision by the reader. Investors should conduct their own due diligence regarding the prospects of any security discussed herein based on such investors’ own review of publicly available information. Clients of Sandbox Financial Partners may maintain positions in the markets, indexes, corporations, and/or securities discussed within The Sandbox Daily. Any projections, market outlooks, or estimates stated here are forward looking statements and are inherently unreliable; they are based upon certain assumptions and should not be construed to be indicative of the actual events that will occur.


