Improved market structure, plus labor shifts, new car prices, demand concerns, and investor sentiment
The Sandbox Daily (11.16.2023)
Welcome, Sandbox friends.
Today’s Daily discusses:
market technicals have vastly improved
workforce set to expand in coming decade
new car prices have gone vertical
demand concerns from the C-Suite
investor sentiment little changed
Let’s dig in.
Markets in review
EQUITIES: S&P 500 +0.12% | Nasdaq 100 +0.10% | Dow -0.13% | Russell 2000 -1.52%
FIXED INCOME: Barclays Agg Bond +0.55% | High Yield +0.13% | 2yr UST 4.851% | 10yr UST 4.441%
COMMODITIES: Brent Crude -4.48% to $77.54/barrel. Gold +1.02% to $1,984.3/oz.
BITCOIN: -3.87% to $36,210
US DOLLAR INDEX: +0.01% to 104.392
CBOE EQUITY PUT/CALL RATIO: 0.48
VIX: +0.99% to 14.32
Quote of the day
“Volatility doesn’t wear a sign around its neck or call ahead. It simply arrives, in a different guise nearly every time.”
- Josh Brown, in The Only Reason Investing Works is Because Things Can Go Wrong
Market structure has vastly improved
Many market technicians have noted that several oversold technical indicators have reversed higher in the last week or two, which is a solid first step toward announcing the end of the July-October market correction.
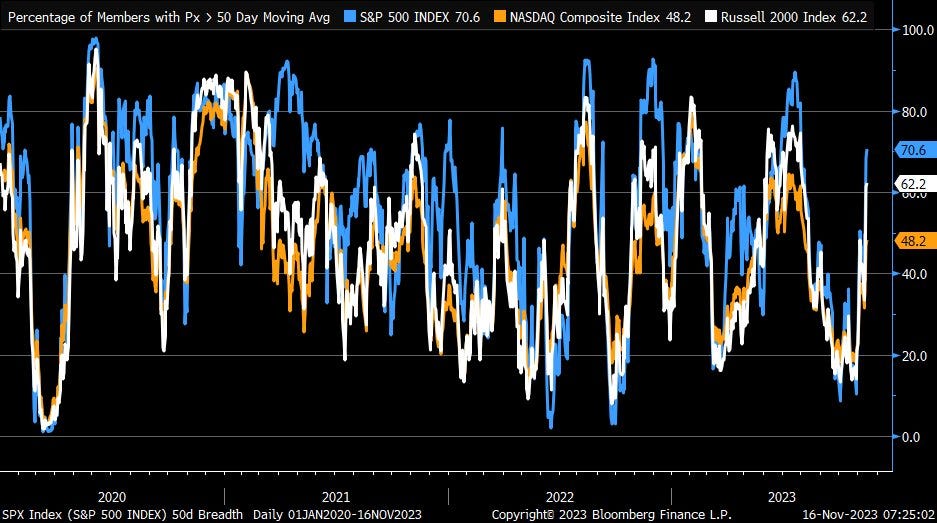
One example would be the percentage share of stocks trading above their 50-day moving averages, which has reversed sharply higher in November.
The 50-DMA for the S&P 500 is currently 70.6%; that measure bottomed at 10.38% as recently as October 27th.
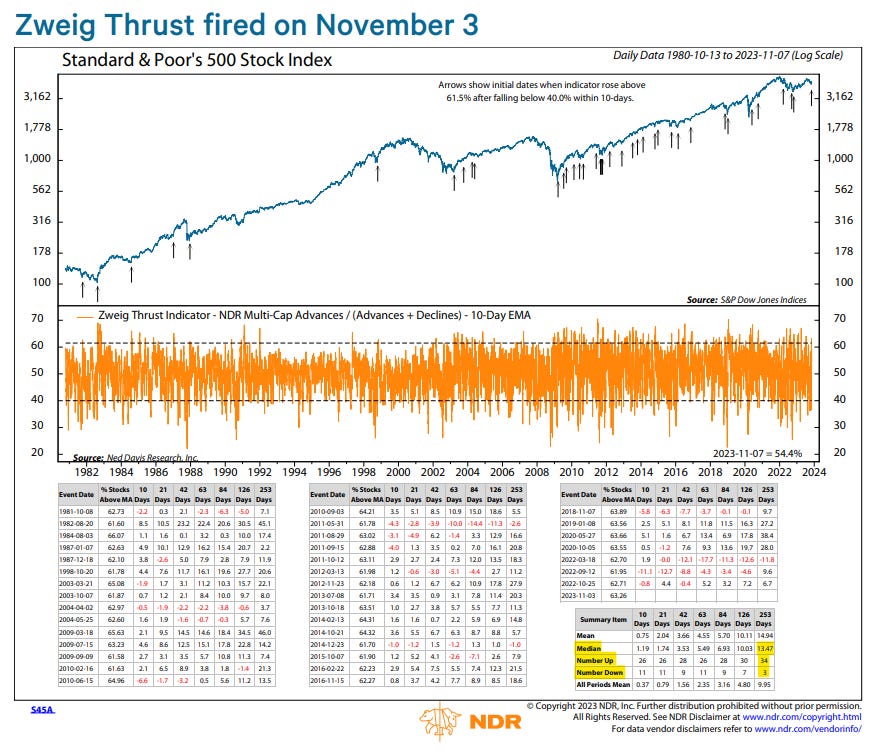
Other bullish measures like breadth thrust indicators – essentially big, fast improvements in the Advance/Decline Line – have been firing as well, as more stocks are advancing higher than declining lower.
Here is the Zweig Breadth Thrust which fired on Friday, November 3rd, a rare signal with an impeccable record for forward S&P 500 returns. We previously covered the Zweig measure here.
As you can see in the “Summary Item” table in the bottom right corner below, the S&P 500 is higher 92% of the time 253 days following the signal.
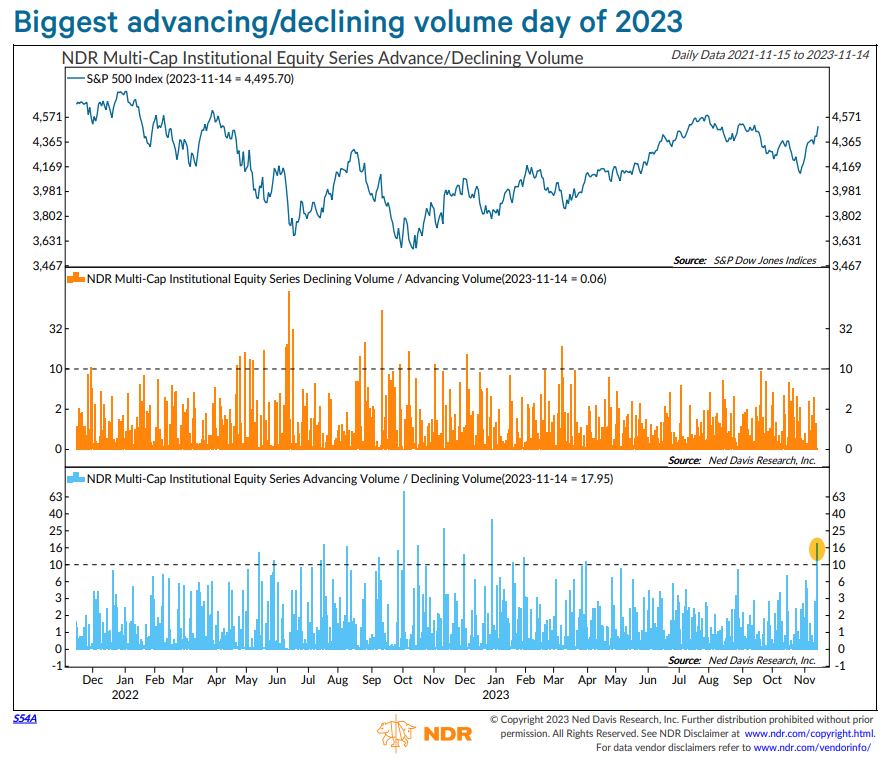
And one technical feature missing until this week was a 10:1 up day, where the total volume of stocks that advanced on the day being 10 times the total volume of stocks that declined on that day.
November 14th was an 18:1 up day, the best reading of the year.
Reversal patterns being confirmed across a variety of breadth and momentum indicators is encouraging to see – confirming the last few weeks of upward price action.
Source: Liz Ann Sonders, Ned Davis Research
Workforce set to expand in coming decade
For roughly the previous 10 years – between 2011-2022 – the potential workforce of adults in their prime earning years (35-60) was essentially unchanged on a net basis as the large population of Boomers retiring were offset by the replacement of millennials. See the top panel of the chart below.
But, as the bottom panel shows, this net effect begins to fade after 2022 when the workforces begins to expand again as more and more millennials enter their prime earning years.
Economic output often aligns with labor cycles over longer time frames.
Source: Fundstrat
New car prices have gone vertical
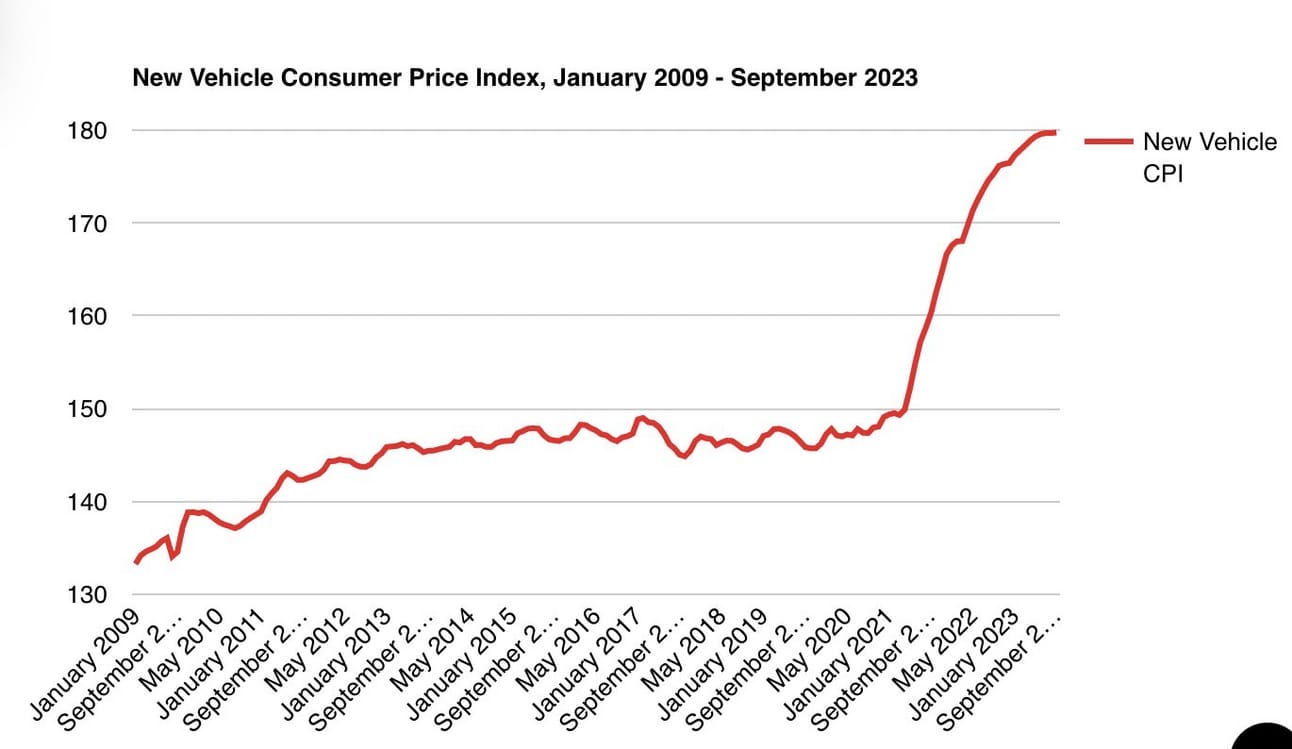
Between January 2020 and September 2023, new car prices increased by 22%.
Vehicle affordability has come off the highs of the cycle, but remain historically elevated over recent years.
This is the inflation in the everyday, real economy. H/T chip shortage and high interest rates, among many other factors.
While the price surge in vehicles in percentage terms was much less extreme than many other categories, the hefty price tag that comes alongside a new vehicle transaction is what grabs people’s attention.
Source: Unusual Whales, Cox Automotive
Demand concerns from the C-Suite
A Bloomberg analysis of earnings call transcripts shows “weak demand” is among the top trending phrases in both the United States and Europe.
More and more C-Suite executives are flagging concerns over the looming threat of an economic slowdown.
These mentions are the highest on record, according to data going back to 2000.
Source: Bloomberg
Investor sentiment little changed
Investors held steady on their market outlook despite the S&P 500 Index rising to its highest level since early September.
The American Association of Individual Investors (AAII) reported bullish sentiment only rose marginally for the second week in a row to 43.8% – but is at its highest percentage since the week ended August 11. Meanwhile, bearish sentiment held steady.
This suggests equity positions are still held lightly and market conviction remains absent from investor’s minds.
Source: Dwyer Strategy
That’s all for today.
Blake
Welcome to The Sandbox Daily, a daily curation of relevant research at the intersection of markets, economics, and lifestyle. We are committed to delivering high-quality and timely content to help investors make sense of capital markets.
Blake Millard is the Director of Investments at Sandbox Financial Partners, a Registered Investment Advisor. All opinions expressed here are solely his opinion and do not express or reflect the opinion of Sandbox Financial Partners. This Substack channel is for informational purposes only and should not be construed as investment advice. The information and opinions provided within should not be taken as specific advice on the merits of any investment decision by the reader. Investors should conduct their own due diligence regarding the prospects of any security discussed herein based on such investors’ own review of publicly available information. Clients of Sandbox Financial Partners may maintain positions in the markets, indexes, corporations, and/or securities discussed within The Sandbox Daily. Any projections, market outlooks, or estimates stated here are forward looking statements and are inherently unreliable; they are based upon certain assumptions and should not be construed to be indicative of the actual events that will occur.


