📉 Inflation down again, falling for the 12th consecutive month 📉
The Sandbox Daily (7.12.2023)
Welcome, Sandbox friends.
Today’s Daily discusses:
CPI continues disinflation trend
U.S. dollar breaks down
Key breadth measure favors the bulls
Let’s dig in.
Markets in review
EQUITIES: Nasdaq 100 +1.24% | Russell 2000 +1.05% | S&P 500 +0.74% | Dow +0.25%
FIXED INCOME: Barclays Agg Bond +0.81% | High Yield +0.78% | 2yr UST 4.751% | 10yr UST 3.865%
COMMODITIES: Brent Crude +1.12% to $80.28/barrel. Gold +1.37% to $1,963.7/oz.
BITCOIN: -0.81% to $30,326
US DOLLAR INDEX: -1.16% to 100.551
CBOE EQUITY PUT/CALL RATIO: 0.39
VIX: -8.76% to 13.54
Quote of the day
“The greatest trick the devil ever pulled was convincing investors that volatility and risk were the same thing.”
- Unknown
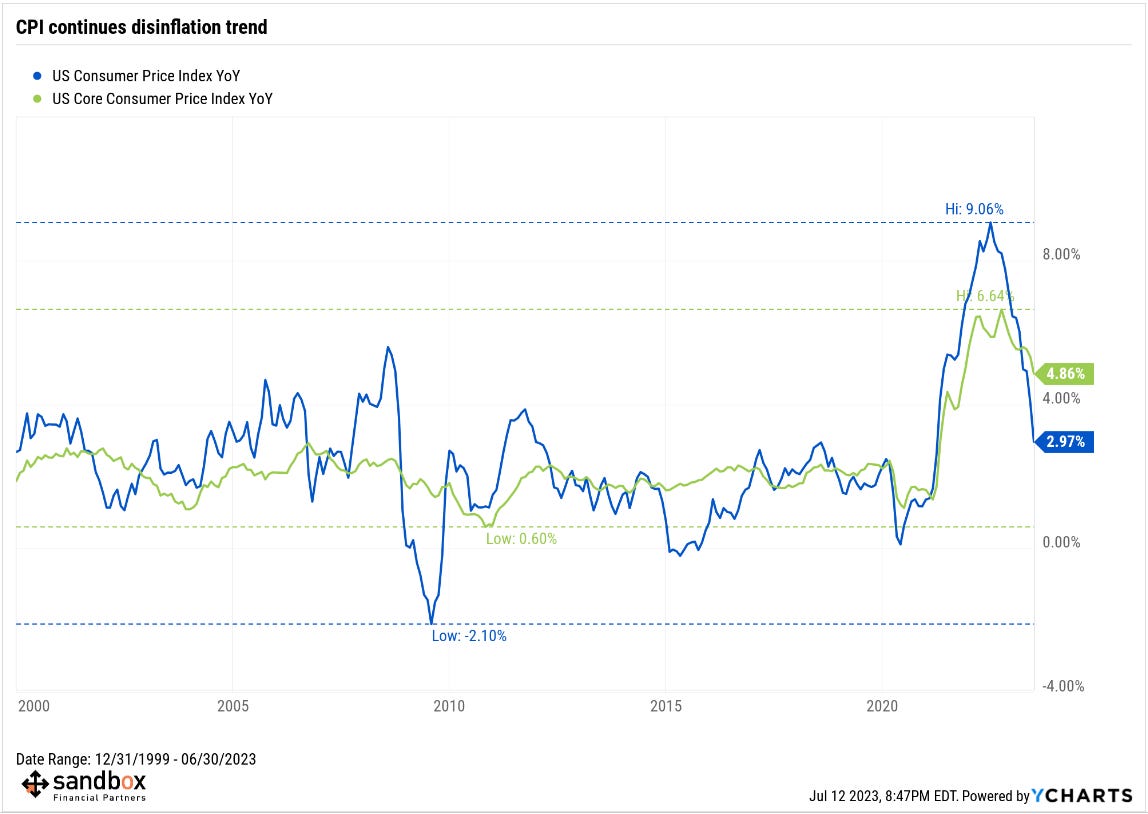
CPI continues disinflation trend
This morning, the U.S. Bureau of Labor Statistics released their Consumer Price Index (CPI) report for June. U.S. consumer prices continue to slow, coming in below market expectations across the board.
Headline Inflation
CPI: +0.2% MoM, versus +0.3% estimate and prior month of +0.1%
CPI: +3.0% YoY, versus +3.1% estimate and prior month of +4.0%
Core Inflation
CPI ex-food and inflation: +0.2% MoM, versus +0.3% estimate and prior month of +0.4%
CPI ex-food and inflation: +4.8% YoY, versus +5.0% estimate and prior month of +5.3%
Headline CPI (+2.97%) moved down for the 12th consecutive month in YoY rate of inflation and printed the slowest annualized increase since March 2021 (+2.62%). The table below shows the ramp up and subsequent ramp down in the YoY headline numbers. We are firmly off the cycle peak of +9.06% from last June.
In one year, we have watched 500 basis points of rate hikes (!!) take inflation down from +9.06% to +2.97%. That’s progress.
Meanwhile, Core CPI (ex-food & energy) moved down to +4.86%.
The lagging shelter category of Core CPI continues to be an issue and one of great contention; many Fed watchers would like to see other reputable, more high-frequency data incorporated into the FOMC’s analysis. The focus continues to be Core Services inflation (blue bar charts below).
Some of this month’s moderation is due to a favorable base effect, as a year ago both headline and core CPI were registering some of the highest monthly gains in this cycle. But beyond this effect, the underlying trends are also to the downside. On a 3-month annualized basis, headline inflation was 2.7%, while core inflation was 4.1%, the least since September 2021.
Although the market expects the Federal Reserve to raise rates during this month’s Federal Open Market Committee (FOMC) meeting on July 25-26, further evidence of ebbing inflation pressure increase the chances that this month marks the last hike of this Fed rate hiking cycle.
With the labor market holding up and the economy still growing – albeit at a slower rate – it appears the Fed is on its way to that elusive soft landing!
Source: Bureau of Labor Statistics, Ned Davis Research, LPL Research, Bloomberg
Dollar breaks down
The U.S. dollar is breaking down below a key price level, marking new 52-week lows and is now at its lowest level since April 2022.
And thanks to sellers taking control of the market, today’s session is offering another critical piece of confirming evidence – an oversold reading on the 14-day relative strength index (RSI).
Today’s oversold reading marks a significant shift in momentum, favoring dollar bears and continued USD weakness.
More importantly for the broader market, a weaker dollar could act as a catalyst for the next leg higher in risk assets.
Source: All Star Charts
Key breadth measure shows support for the bulls
Today marked a new year-to-date high for the New York Stock Exchange New Highs – New Lows list.
You can’t have a bull market without bulls, meaning an expansion of new highs. That’s why it’s critical to look beneath the surface for signs of market health.
The New Highs – New Lows lists is a classic breadth indicator measuring the internal strength or weakness in the market – i.e. are more stocks making highs or lows. When the indicator is positive because we have more new highs than new lows, the underlying trend favors the bulls.
Source: StockCharts.com
That’s all for today.
Blake
Welcome to The Sandbox Daily, a daily curation of relevant research at the intersection of markets, economics, and lifestyle. We are committed to delivering high-quality and timely content to help investors make sense of capital markets.
Blake Millard is the Director of Investments at Sandbox Financial Partners, a Registered Investment Advisor. All opinions expressed here are solely his opinion and do not express or reflect the opinion of Sandbox Financial Partners. This Substack channel is for informational purposes only and should not be construed as investment advice. Clients of Sandbox Financial Partners may maintain positions in the markets, indexes, corporations, and/or securities discussed within The Sandbox Daily.


