Inflation, savings, and earnings guidance
The Sandbox Daily (7.13.2023)
Welcome, Sandbox friends.
Today’s Daily discusses:
unpacking the inflation dilemma
excess savings dwindling
highest number of S&P 500 companies issuing positive EPS guidance sine 3Q21
wholesale prices (PPI) for June point to further easing of inflation pressures
Let’s dig in.
Markets in review
EQUITIES: Nasdaq 100 +1.73% | Russell 2000 +0.91% | S&P 500 +0.85% | Dow +0.14%
FIXED INCOME: Barclays Agg Bond +0.62% | High Yield +0.60% | 2yr UST 4.651% | 10yr UST 3.777%
COMMODITIES: Brent Crude +1.66% to $81.61/barrel. Gold +0.07% to $1,963.1/oz.
BITCOIN: +3.29% to $31,417
US DOLLAR INDEX: -0.76% to 99.788
CBOE EQUITY PUT/CALL RATIO: 0.52
VIX: +0.52% to 13.61
Quote of the day
“For the best results with your children, spend only half the money you think you should but double the time with them.”
- Kevin Kelly, Wired Magazine Founding Executive Editor
Unpacking inflation
As we near the end of this inflationary cycle, many investors are wondering what to make of the incoming data going forward. Stick with me, this is a mental exercise of math.
Barring zero growth or even negative monthly CPI prints for the rest of the year, CPI as computed on a year-over-year basis will increase. For investors, the dilemma is decoding the stark differences between changes and absolute levels of both monthly and annual CPI figures.
To wit, Wednesday's Consumer Price Index report fell from 4.0% to 3.0%. The reason for the considerable drop has little to do with the latest June monthly CPI figure. Instead, the 1.2% monthly June 2022 increase in CPI from a year ago fell out of the annual calculation – these are called “basing effects.” Thus, the dilemma facing investors is how much stock we should put into recent CPI data versus annualized inflation data.
To appreciate the dilemma, if next month's monthly CPI figure is 0.1%, the YoY inflation rate will increase from 3.0% to 3.1%. Despite an annualized monthly inflation rate of just 1.2%, annual CPI will increase as a 0.00% monthly figure from a year ago will fall out of the calculation.
When CPI is not volatile, as was the case pre-pandemic, year-over-year CPI provides a good inflation trend. However, when it's volatile (like this past year), most prefer to follow trend data from the last 3 months. Such reasonably estimates recent inflation and ignores older and less relevant data points.
Source: Real Investment Advice
Excess savings dwindling
How long will the U.S. consumer support our GDP?
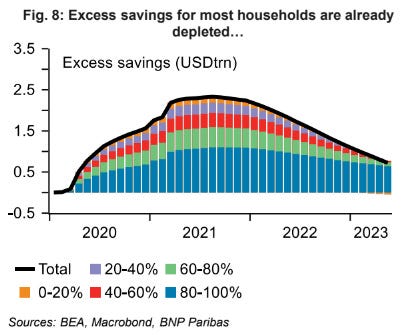
BNP Paribas estimates that the “top income quintile currently holds just over 80% of excess savings. The 0-20% and 20-40% quintiles have already depleted their excess savings balances, while the 40-60% quintile will likely follow in the next month or so.”
Excess savings built up during the early days of the COVID-19 pandemic are being exhausted for the vast majority of the population.
Source: Daily Chartbook, BNP Paribas
Highest number of S&P 500 companies issuing positive EPS guidance sine 3Q21
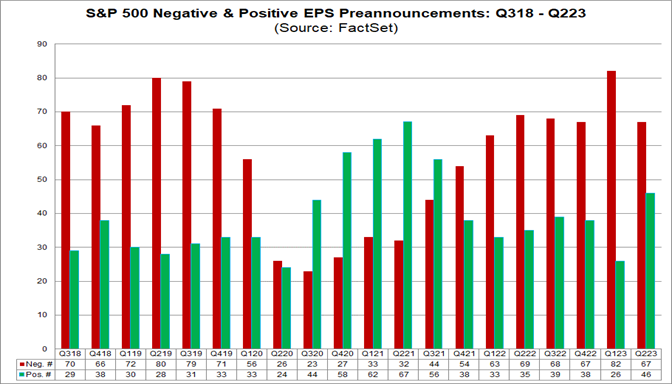
As of this week, 113 companies withing the S&P 500 index have issued EPS guidance for the 2nd quarter. 67 companies have issued negative EPS guidance, while 46 have issued positive EPS guidance.
While the number of S&P 500 companies issuing negative EPS guidance for Q2 is consistent with the numbers in 4 of the past 5 quarters, the number of S&P 500 companies issuing positive EPS guidance for Q2 is well above the numbers of the past few quarters.
In fact, the 2nd quarter has seen the highest number of S&P 500 companies issuing positive EPS guidance for a quarter since Q3 2021 (56).
Many are expecting 2nd quarter earnings to be the trough of the cycle – perhaps CEO’s are looking towards a brighter future already.
Source: FactSet
Wholesale prices (PPI) for June point to further easing of inflation pressures
The Labor Department released its latest Producer Price Index (PPI) for June, tracking inflation from the standpoint of manufacturers and wholesalers.
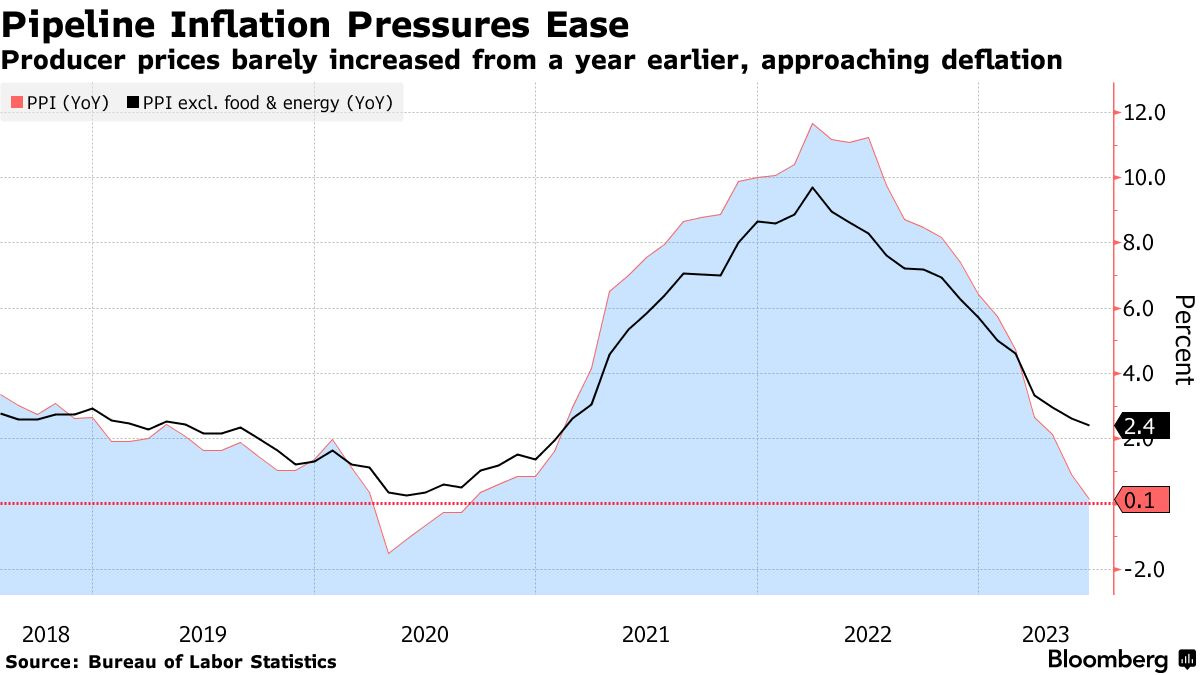
June's PPI report (producer prices) confirms what the CPI report (consumer prices) showed Wednesday morning – price growth is moderating materially – with wholesale prices rising just +0.1% YoY in June, the smallest advance since 2020.
Headline PPI rose just +0.1% year-over-year, down from +1.1% in May and the lowest reading since August 2020! The cycle peak was +11.7% back in March 2022, with the index down 14 of the last 15 months. Looking back at a longer time frame of the data series, the current readings are below historical measures.
The PPI report differs from the CPI report in that it measures prices that producers pay for the goods and services they need.
This report, along with the cooler-than-expected CPI inflation for June, supports the view that easing inflationary pressures – upstream and downstream – increase the chances that this month marks the last hike of this Fed rate hiking cycle.
Source: Bureau of Labor Statistics, Ned Davis Research, Bloomberg
That’s all for today.
Blake
Welcome to The Sandbox Daily, a daily curation of relevant research at the intersection of markets, economics, and lifestyle. We are committed to delivering high-quality and timely content to help investors make sense of capital markets.
Blake Millard is the Director of Investments at Sandbox Financial Partners, a Registered Investment Advisor. All opinions expressed here are solely his opinion and do not express or reflect the opinion of Sandbox Financial Partners. This Substack channel is for informational purposes only and should not be construed as investment advice. Clients of Sandbox Financial Partners may maintain positions in the markets, indexes, corporations, and/or securities discussed within The Sandbox Daily.


