Investment time horizons, plus Dr. Copper, triaging mistakes, and deflation in China
The Sandbox Daily (8.9.2023)
Welcome, Sandbox friends.
Today’s Daily discusses:
understand your time horizon
Dr. Copper ignoring the doom and gloom
treat mistakes as learning opportunities
deflation in China
Let’s dig in.
Markets in review
EQUITIES: Dow -0.54% | S&P 500 -0.70% | Russell 2000 -0.86% | Nasdaq 100 -1.12%
FIXED INCOME: Barclays Agg Bond +0.07% | High Yield +0.01% | 2yr UST 4.812% | 10yr UST 4.016%
COMMODITIES: Brent Crude +1.43% to $87.40/barrel. Gold -0.60% to $1,948.1/oz.
BITCOIN: -1.58% to $29,485
US DOLLAR INDEX: -0.02% to 102.503
CBOE EQUITY PUT/CALL RATIO: 0.65
VIX: -0.19% to 15.96
Quote of the day
“Winning teaches you nothing. Losing can be the greatest teacher of all.”
- Stan Weinstein, Secrets for Profiting in Bull and Bear Markets
Understand your time horizon
An investment time horizon is how long an investor expects to own a particular security, or investment. Time horizons vary for different investment strategies—from a few hours or days to years and potentially decades.
Generally, a longer time horizon allows investors to participate in the value creation of the underlying business over one or many market cycles. It’s also more conducive to a riskier set of investments, as it allows more time for the market to recover from any setbacks along your investment journey.
Over shorter time frames however, markets are inherently uncertain, volatile, and often detached from underlying fundamentals – as investor positioning and sentiment are more powerful forces at any given moment.
Here is a look at how often the S&P 500 index is positive or negative over a variety of time horizons:
Two takeaways emerge from this chart:
1. Over very short time periods, market performance is nearly impossible to determine – a random walk down wall street, as they say. Daily (and weekly, but not shown) returns are fairly evenly distributed among positive and negative outcomes. What will the market do tomorrow? Roughly 50-50 odds going either direction.
2. The longer you invest, the higher the probability that you'll make money. This is mostly because of earnings cycles, market liquidity, and the velocity of money which all favor long-term growth patterns. Investing can be very difficult, especially over shorter time periods or during market corrections (such as the market environment in 2022), but it’s prudent to extend your time horizon and allow time and compounding to do the heavy lifting. Renowned investor Warren Buffett is credited with saying: “Investing is simple, but not easy.”
Source: Compounding Quality
Dr. Copper ignoring the doom and gloom
Dr. Copper remains buoyant amidst pervasive concerns of a pending economic downturn.
Many refer to the copper commodity as “Dr. Copper” because it tends to forecast the economy better than most economists. It appears as though Dr. Copper is once again disagreeing with the consensus economic forecast.
Consensus says U.S. and global economic growth is slowing, and the U.S. is heading for a nice soft landing of the economy. However, copper prices have been rallying within the context of a what appears to be a multi-year bull market, suggesting global growth is accelerating not slowing.
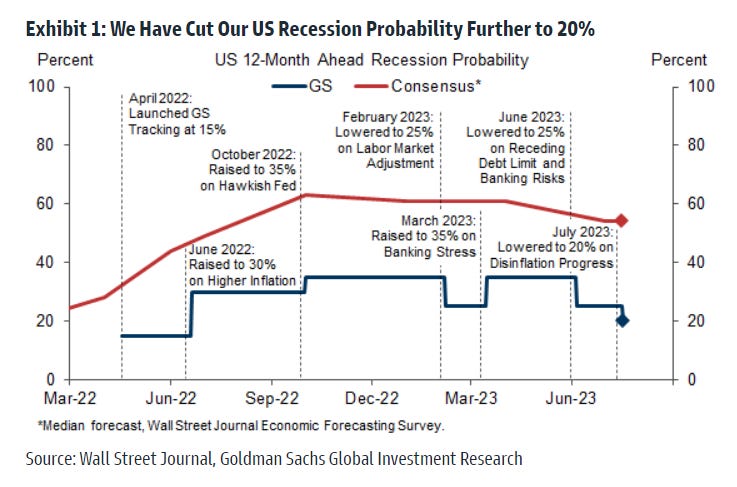
Consensus also calls for a recession in the United States, where the median forecast among economists polled by the Wall Street Journal give a 54% probability (red line below) to a recession.
Over the last year, copper has proved quite resilient. This is not necessarily what you would expect against a backdrop of bank failures/downgrades, globally synchronized restrictive monetary policies, an earnings valley, a U.S. sovereign credit rating downgrade, and constant calls of recession. Oftentimes focusing your analysis on price – and not headlines – is what matters most.
More near term, the copper chart is a mess.
The August 2022 pivot high at approximately $3.80 marks a potential near-term support level; a decisive break below this general level would signal increased downside risks. Bulls would like to see copper reclaim the November 2022 high around $3.96 soon rather than later, especially after a failed breakout at the end of July.
Source: Goldman Sachs Global Investment Management, Richard Bernstein Advisors, Grindstone Intelligence
Treat mistakes as learning opportunities
Every investor makes mistakes.
Determine what went wrong and use that painful experience for personal growth and development as an investor.
Here is one example (i.e. flow chart) showing how you can learn from them.
Source: Adioma Infographics
Deflation in China
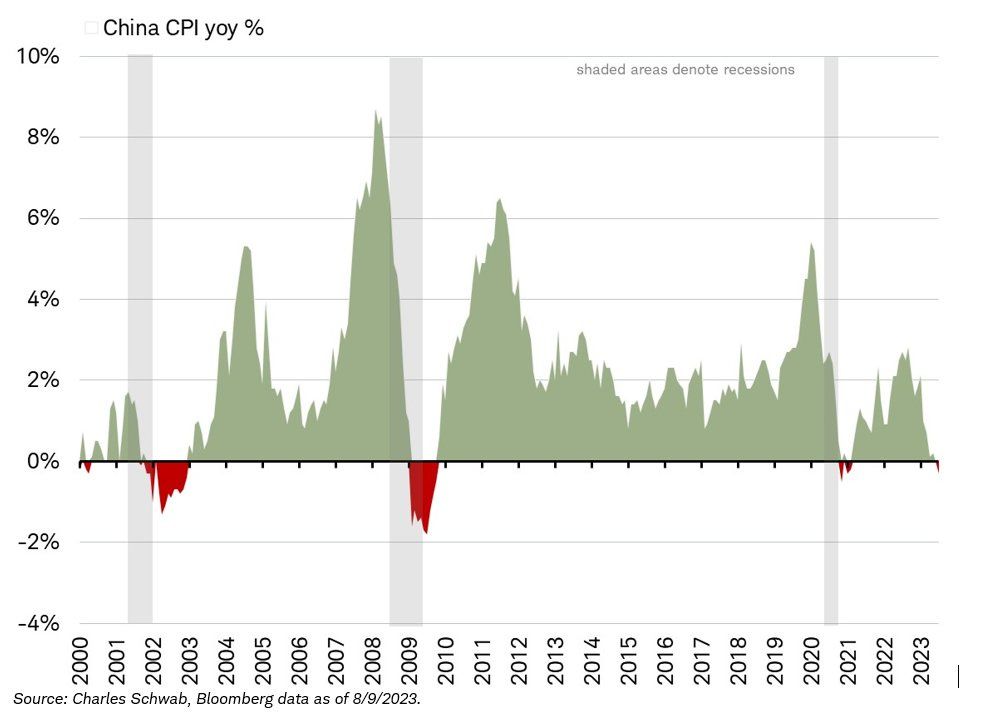
China’s consumer and producer prices fell together for the 1st time since 2020.
The National Bureau of Statistics in China reported that the Consumer Price Index (CPI) registered its 1st decline in more than two years, falling 0.3% YoY in July. At the same time, the Producer Price Index (PPI) fell for a 10th consecutive month, contracting 4.4%.
China is the 1st G20 economy to report a year-over-year decline in consumer prices since Japan's last negative headline CPI reading in August 2021. The world’s 2nd largest economy is closely tied to global demand which has economists worried.
Historically, dips by inflation into negative territory happened only around global recessions (2001, 2008-09 and 2020).
Source: Reuters, Jeffrey Kleintop
That’s all for today.
Blake
Welcome to The Sandbox Daily, a daily curation of relevant research at the intersection of markets, economics, and lifestyle. We are committed to delivering high-quality and timely content to help investors make sense of capital markets.
Blake Millard is the Director of Investments at Sandbox Financial Partners, a Registered Investment Advisor. All opinions expressed here are solely his opinion and do not express or reflect the opinion of Sandbox Financial Partners. This Substack channel is for informational purposes only and should not be construed as investment advice. Clients of Sandbox Financial Partners may maintain positions in the markets, indexes, corporations, and/or securities discussed within The Sandbox Daily.


