Leading indicators flash red, plus financials, $31.4 trillion debt, stock≠business, and the week in review
The Sandbox Daily (4.21.2023)
Welcome, Sandbox friends.
Today’s Daily discusses:
leading economic indicators warn of recession ahead (again)
financials fighting back
visualizing the $31.4 trillion dollar debt
short-term = price, long-term = value
a brief recap to snapshot the week in markets
A relatively calm week for the S&P 500! The index remained in a narrow 55-point range, the tightest this year.
Hope everyone has a wonderful weekend!
Let’s dig in.
Markets in review
EQUITIES: Nasdaq 100 +0.11% | Russell 2000 +0.10% | S&P 500 +0.09% | Dow +0.07%
FIXED INCOME: Barclays Agg Bond -0.17% | High Yield +0.31% | 2yr UST 4.182% | 10yr UST 3.568%
COMMODITIES: Brent Crude +0.68% to $81.65/barrel. Gold -1.31% to $1,992.6/oz.
BITCOIN: -3.57% to $27,257
US DOLLAR INDEX: -0.13% to 101.709
CBOE EQUITY PUT/CALL RATIO: 0.74
VIX: -2.33% to 16.77
Quote of the day
“Teach your people to fish rather than give them fish, even if that means letting them make some mistakes.”
- Ray Dalio, Principles
Leading indicators warn of recession ahead (again)
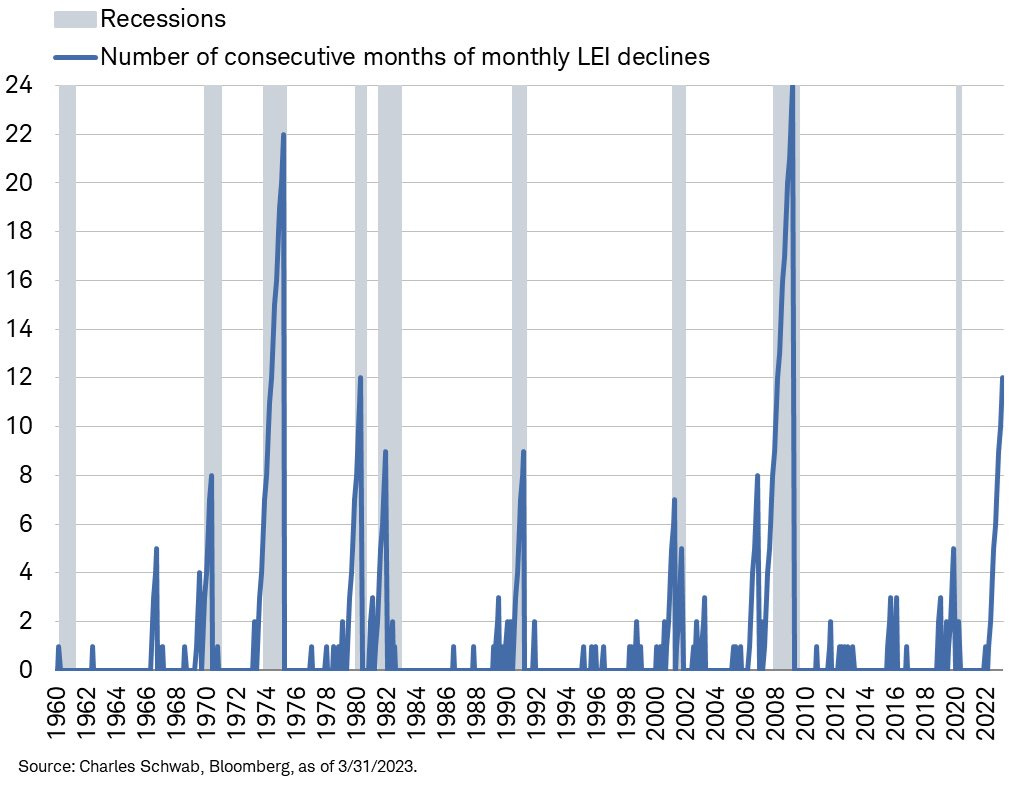
The U.S. Leading Economic Indicators (LEI), compiled by the Conference Board, sank -1.2% in March. The decline was the 12th in a row and the most since April 2020. The only instances we’ve had this many consecutive declines were the recessions that started in 1973,1980, and 2007.
The Conference Board publishes leading, coincident, and lagging indexes designed to signal peaks and troughs in the business cycle for major global economies. Many economists and investors track this measure closely.
As shown below, such a streak of consecutive monthly declines has led to 7 of the last 8 recessions. The pandemic-related recession is the outlier, but given the unexpected and somewhat random nature of the pandemic, it is not surprising that this indicator or any leading indicator could not forecast it.
The pace of decline in the LEI has accelerated, with the 6-month rate of change sliding to -4.5%, the steepest drop since July 2020. Moreover, 8 of the 10 LEI components deteriorated over the past 6 months. The rate of decline in the LEI and the weak indicator breadth are historically consistent with falling economic activity. The Conference Board expects further economic softness in the coming months and a recession start in mid-2023.
Clearly the forward-looking indicators suggest enduring, widespread weakness across the economy. While no forecasting system is perfect, this one has a pretty good track record.
Source: The Conference Board, Ned Davis Research, Liz Ann Sonders
Financials fighting back
The large-cap financial sector SPDR ETF (XLF) has been demonstrating impressive relative strength over the last two weeks, with some big earnings beats from JPMorgan Chase (JPM) and Citigroup (C) helping improve the sentiment around this beaten down group, while other names came in as expected (Goldman Sachs) or reported results better than feared (Charles Schwab).
The ~$30/31 level in XLF not only corresponds with recent pivot lows in March, but also the prior-cycle highs from 2007, 2017, and 2020. As you can see in the top pane of the chart below, buyers stepped in and defended this critical polarity zone again over the past few weeks:
When it comes to the internal health of the financial sector, banks remain a concern. This is particularly true for the regional banks, which is registering their lowest weekly closes since November of 2020.
This chart also demonstrates the divergence between the regional banks and the financial sector as a whole. While the latter is still holding constructively above its 2022 lows, the S&P Regional Bank Index (KRE) violated this level last month and has been coiling since. With earnings now underway, we could expect resolution higher or lower in the coming weeks.
Source: All Star Charts
Visualizing the $31.4 trillion dollar debt
Can you picture what $31.4 trillion looks like?
This graphic shows how many one-dollar bills it would take to stack up to the total U.S. debt of $31.4 trillion.
The U.S. national debt is how much money the federal government owes to creditors. When the government spends more than it earns, it has a budget deficit and must issue debt in the form of Treasury securities. The United States has run a deficit for the last 20 years, substantially increasing the national debt.
Stacked up in one dollar bills, the U.S. debt would be equivalent to almost 8 Sears Towers (ahem, Willis Towers) in Chicago.
Source: Visual Capitalist
Short-term = price, long-term = value
As earnings season heats up, remember to watch the business and not the stock.
Short-term results are impacted by a myriad of factors, such as management execution, industry trends, competitive moat, pricing, operating earnings, technical momentum, analysts ratings, interest rates, inflation, etc. Meaning, the stock price can, and likely will, jump around its intrinsic value.
But, investing is a long-term activity, and a businesses will eventually follow it longer-term value creation.
Source: Brian Feroldi
The week in review
Talk of the tape: Despite the S&P 500’s technical progress this year, investor sentiment and positioning remain significantly bearish. The lack of respect for the market’s recovery and continued investor angst are evident in S&P 500 futures positioning, where non-commercial net futures positioning (speculative trades) reached its lowest level since August 2011 – meaning long positions are weak and short positions are climbing.
Well, perhaps it’s the inverted yield curve, leading economic indicators, energy shock, and Fed policy that all point to a recession – the most anticipated and obvious one at that.
The Bullish dialogue emphasizes the Fed’s handling of the banking scare, big tech leadership, a broader (albeit choppy) disinflation trend, elevated cash levels and still below average positioning, technicals holding strong, and the China reopening story.
Bearish talking points revolve around the central bank balancing act between inflation and financial stability risks, the higher-for-longer narrative, a policy misstep, elevated bond volatility, 10-20% downside risk to consensus earnings estimates, Fed speak and data (esp. Philly Fed) suggesting recession, and the looming debt ceiling debate.
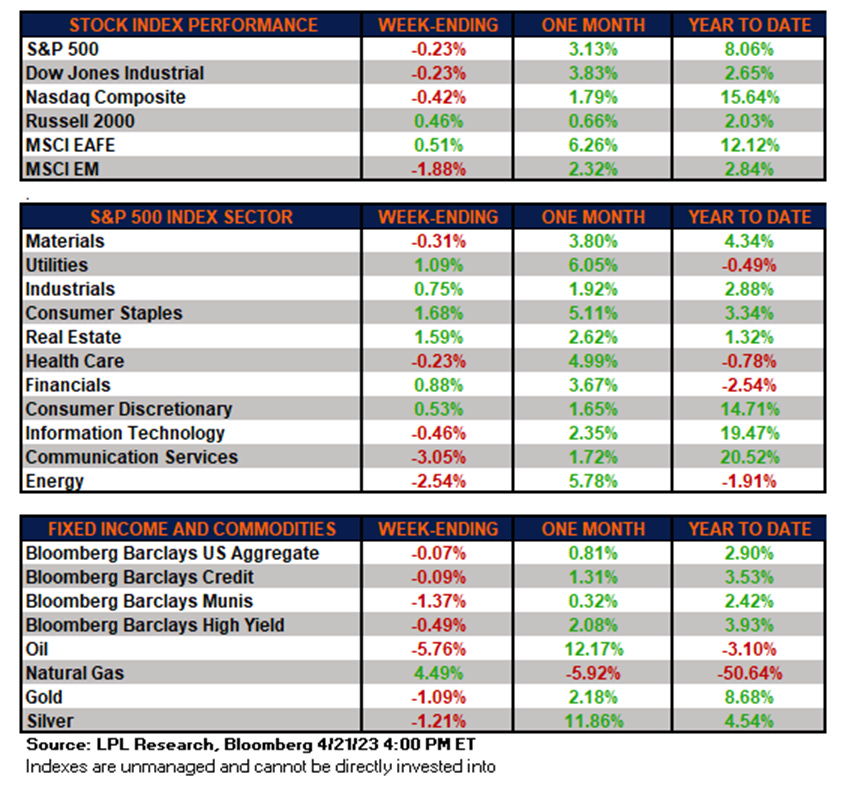
Stocks: Stocks ended the week mostly lower, albeit benign. 1st quarter earnings so far have been met with a mixed reaction, and somewhat better than feared. Communication services, the top performing sector year to date, was this week’s leading detractor. Energy, which has been a top performing sector for the past three straight weeks on firmer crude oil prices, lagged the S&P 500 Index amid this week’s pullback in West Texas Intermediate crude oil. Developed international stocks continue to display strength given improving economic reports.
Bonds: The Bloomberg Aggregate Bond Index finished lower as bond prices declined while yields increased. U.S. high-yield corporate credit spreads have retraced roughly half of their March widening, but nonetheless remain at elevated levels compared to six weeks ago.
Commodities: Crude oil has rallied from March’s 15-month lows and natural gas prices have pulled back given better weather and demand concerns. The major metals (gold, silver, and copper) ended the week lower.
Source: Dwyer Strategy, LPL Research
That’s all for today.
Blake
Welcome to The Sandbox Daily, a daily curation of relevant research at the intersection of markets, economics, and lifestyle. We are committed to delivering high-quality and timely content to help investors make sense of capital markets.
Blake Millard is the Director of Investments at Sandbox Financial Partners, a Registered Investment Advisor. All opinions expressed here are solely his opinion and do not express or reflect the opinion of Sandbox Financial Partners. This Substack channel is for informational purposes only and should not be construed as investment advice. Clients of Sandbox Financial Partners may maintain positions in the markets, indexes, corporations, and/or securities discussed within The Sandbox Daily.


