Long-term S&P 500 average, plus cross-market risk metric, M2 money supply, and housing prices
The Sandbox Daily (4.25.2023)
Welcome, Sandbox friends.
Today’s Daily discusses:
the S&P 500 above its 200 week moving average
a cross-market metric for gauging risk appetite is sliding
M2 money supply contracts further
key housing metric shows existing home prices rose in February
Let’s dig in.
Markets in review
EQUITIES: Dow -1.02% | S&P 500 -1.58% | Nasdaq 100 -1.89% | Russell 2000 -2.40%
FIXED INCOME: Barclays Agg Bond +0.62% | High Yield -0.16% | 2yr UST 3.957% | 10yr UST 3.403%
COMMODITIES: Brent Crude -2.42% to $80.73/barrel. Gold +0.37% to $2,007.1/oz.
BITCOIN: +2.24% to $28,013
US DOLLAR INDEX: +0.50% to 101.855
CBOE EQUITY PUT/CALL RATIO: 0.57
VIX: +11.07% to 18.76
Quote of the day
“Life begins at the end of your comfort zone.”
- Neale Donald Walsch
SPX staying above the 200 week moving average = good news
Today was an ugly tape, with the S&P 500 experiencing its first 1% or more drop in 22 trading days – as the 4,200 price level continues to act as a major resistance level.
Until today, stocks were grinding under the surface for nearly a month as if in a holding pattern for the big tech earnings announcements. After all, the heaviest earnings reports are this week with 178 companies reporting – 42% of the index’s market capitalization – and a significant number of Technology, Financial, and Industrial companies in play. Clearly earnings will be the forefront.
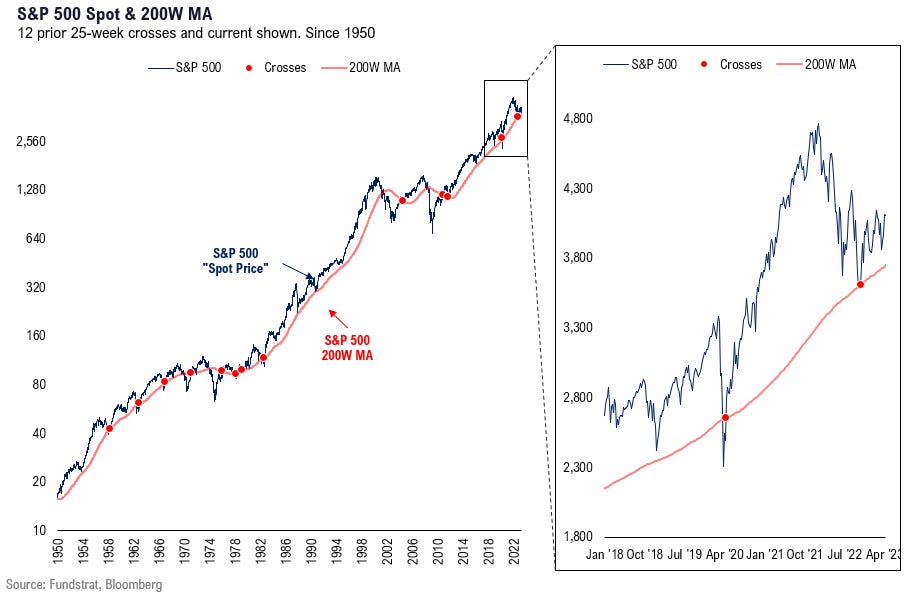
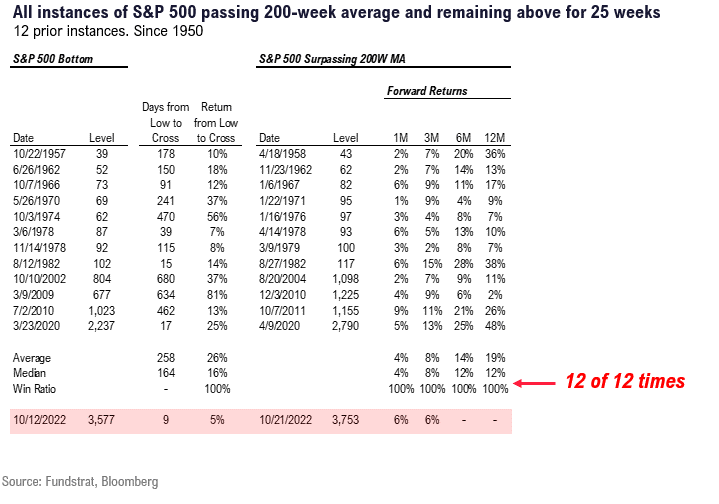
For now, the S&P 500 has remained above its 200 week moving average for 25 weeks now as shown below. On Oct 12, 2022, the S&P 500 touched this level and has since moved higher. This is good news for market bulls.
In fact, in the 12 instances of crossing above the 200 week moving average and staying there for 25 weeks, the S&P 500 is higher in all 12 instances – across 1-month, 3-month, 6-month, and 12-month periods.
Fundstrat arrived at a “25 weeks” threshold because of the numerous failed breakouts/recoveries – aka noise – in this signal if the S&P 500 doesn’t sustainably sit above the 200 week moving average for enough weeks (i.e. 1-10 weeks).
Source: Fundstrat
Risk appetite waning?
One popular cross-market metric for gauging risk appetite is the High Beta (SPHB) vs. Low Volatility (SPLV) ratio.
When the ratio is trending higher, it is because investors are favoring riskier stocks over their alternatives. The overall market tends to move in the same direction as this ratio.
However, when the trend points lower, expressing defensive behavior, it’s usually taking place in a risk-off environment.
After completing a double-bottom formation back in January, the high beta/low vol ratio rocketed higher as the more growthy segments of the market caught a bid. But in the few months since, the trend has shifted back to the downside, peaking in February and retreating back to its old range.
As long as this ratio is beneath its breakout level, it would indicate a risk-off tone for the market.
Source: All Star Charts
M2 money supply contracts further
The Federal Reserve updated investors on the amount of U.S. money supply in circulation today, a key input for the central bank’s thinking on their interest-rate decision due Wednesday of next week (May 3rd) and offering a crucial clue to the path of future inflation.
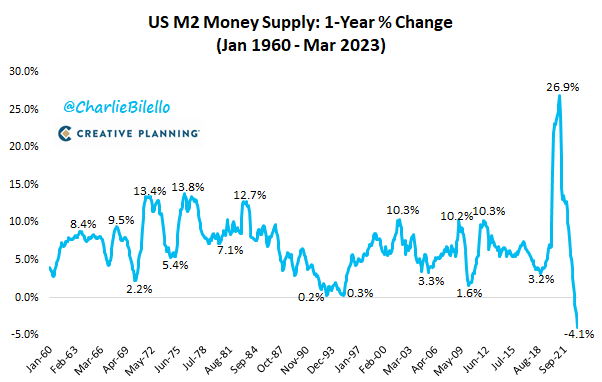
Money supply, as measured by M2, has fallen -4.1% over the last 12 months, the largest year-over-year decline on record.
M2 is an aggregate measure of the currency, coins, and savings deposits held by banks, balances in retail money-market funds, and more. This measurement/classification of money in the financial system entered the spotlight earlier this year after contracting on an annual basis for three straight months – an unprecedented streak since the data was first introduced in 1959. December was M2’s first year-over-year contraction ever, followed by January’s 1.75% fall and February’s 2.4% decline to $21.1 trillion, the steepest drop in money supply yet.
While M2 money supply contraction is now firmly in negative territory, the absolute level is still miles above the pre-COVID highs. It will be difficult to unwind this tremendous increase in the money supply, similar to the post-GFC environment.
So, how does inflation and the Fed’s interest rate hiking cycle come into play?
Well, the amount of money in the financial system is one of many critical factors for inflation. Very simply put, the less money there is floating around in the economy, the less there is for banks to lend and for companies and consumers to borrow and spend. In turn, that pushes down prices, helping cool the economy. As the economy shows signs of cooling across a multitude of measures, the Fed is less inclined to deliver further rate hikes.
Source: St. Louis Fed, Charlie Bilello, Investopedia
Key housing metric shows existing home prices rose in February
U.S. home prices ticked up moderately in February after 7 straight months of declines, as lower mortgage rates boosted housing demand amid tight inventory levels. Before the recent decline, this index of home prices had underwent 126 monthly sequential increases that began in January 2012.
The S&P CoreLogic Case-Shiller National Home Price Index, which measures home prices across the nation, increased +0.2% month-over-month in February, and +2.0% year-over-year. This cycle’s peak of +20.8% home price growth occurred back in March 2022.
The 10-city and 20-city composite indexes (tracking the 10 and 20 largest housing markets in the United States) posted a +0.4% YoY growth rate. For the 7th consecutive month, Miami posted the biggest one-year price jump, up +10.8%. It was followed by Tampa (+7.7%), Atlanta (+6.6%), and Charlotte (+6.0%). The number of cities where annual prices dipped doubled from January. Prices declined again in San Francisco (-10.0%), Seattle (-9.3%), San Diego (-4.1%), and Portland (-3.2%).
February is typically when the real estate market’s busiest selling season starts to get underway, as the spring and summer are strong seasonally.
“While annual price growth is still slowing, a reversal from negative monthly growth to positive monthly growth shows signs that the normality of the spring home shopping season is returning,” said Nicole Bachaud, a senior economist at Zillow.
Source: S&P Dow Jones Indices, Bloomberg, Calculated Risk
That’s all for today.
Blake
Welcome to The Sandbox Daily, a daily curation of relevant research at the intersection of markets, economics, and lifestyle. We are committed to delivering high-quality and timely content to help investors make sense of capital markets.
Blake Millard is the Director of Investments at Sandbox Financial Partners, a Registered Investment Advisor. All opinions expressed here are solely his opinion and do not express or reflect the opinion of Sandbox Financial Partners. This Substack channel is for informational purposes only and should not be construed as investment advice. Clients of Sandbox Financial Partners may maintain positions in the markets, indexes, corporations, and/or securities discussed within The Sandbox Daily.


