

Market drawdowns, plus sufficiently restrictive, $30k Bitcoin, earnings season, and marginal return
The Sandbox Daily (4.11.2023)

Welcome, Sandbox friends.
Today’s Daily discusses:
market drawdowns
what does the Fed mean by “sufficiently restrictive”
Bitcoin hits $30,000
earnings season kicks off
law of diminishing marginal return
Let’s dig in.
Markets in review
EQUITIES: Russell 2000 +0.80% | Dow +0.29% | S&P 500 0.00% | Nasdaq 100 -0.67%
FIXED INCOME: Barclays Agg Bond +0.06% | High Yield +0.21% | 2yr UST 4.033% | 10yr UST 3.428%
COMMODITIES: Brent Crude +1.64% to $85.56/barrel. Gold +0.79% to $2,019.8/oz.
BITCOIN: +3.27% to $30,115
US DOLLAR INDEX: -0.42% to 102.147
CBOE EQUITY PUT/CALL RATIO: 0.63
VIX: +0.69% to 19.10
Quote of the day
“Planning is important, but the most important part of every plan is to plan on the plan not going according to plan.”
-Morgan Housel, The Psychology of Money
Market drawdowns
The only reason we get returns over the long run is because we occasionally experience losses in the short run. Volatility is the price you pay to participate in the game; sometimes stocks go up and other times they go down. This is a feature of the stock market, not a bug.
Since 1980, the S&P 500 has average an intra-year drop of 14.3%.

But that is just the average across the last 43 years, not telling us the frequency of different drawdowns. After all, a 5% of 10% correction is a very different psychological experience than say a 15% or 20% drawdown. This chart from Ben Carlson shows how often the U.S. stock market has experienced the following losses:

This tells us we should expect a double-digit correction at some point during a calendar year roughly two-thirds of the time.
Using a slightly different approach, the Capital Group quantified how often we experience different levels of drawdowns; their data suggests we will experience a double-digit drawdown about once per year.

Watching your portfolio decrease in value is never fun, but market pullbacks are more common than we think. Volatility can take a psychological toll on investors and increase the possibility of making a mistake. And, the deeper the market selloff becomes, the longer it takes on average for portfolios to recover – even more frustrating.
But if you’re a long-term investor and save/invest on a regular basis, these corrections are actually a good thing because it presents an opportunity to buy stocks on sale. If you have a long-time horizon you should prefer down markets because you can buy when prices are low, which will lead to better returns over the long haul.
As always, set the right expectations and use history as your guide.
Source: JPMorgan Guide to the Markets, A Wealth of Common Sense, Capital Group
What is sufficiently restrictive?
During the current tightening cycle, the Federal Reserve has never quantified what “sufficiently restrictive” means. This presents a conundrum for markets: if investors don’t know when the Fed has achieved its stated goal, then uncertainty will continue to define most outcomes. And markets don’t like uncertainty. So, Ned Davis Research (NDR) has attempted to define it for us.
Economically restrictive is about the real cost of borrowing (i.e. the Fed Funds Rate – the inflation rate) and the cost and availability of credit. With respect to the Real Fed Funds Rate, NDR reviewed the past 10 tightening cycles and what the level of the Real Fed Funds Rate was at the end of each tightening cycle. Removing the outlier outcomes in each tail produced a range from 2.50% to 4.25% (as denoted by the yellow box in the chart below) and is consistent with the 3.1% median of all 10 observations.
Based on the Fed’s Summary of Economic Projections, the Fed sees the Real Fed Funds Rate at 1.5% this year and at 1.7% in 2024, which is denoted by the gray box on the chart.
The Fed has finally gotten the Real Fed Funds Rate into positive territory this year (yellow circle below), although there is still quite a bit of room between the current level and the restrictive zones. That gap represents the potential for additional tightening of policy.

However, this analysis is incomplete as it doesn’t consider financial stability, because on the way to becoming sufficiently restrictive economically, the Fed broke something – 4 banks, to be specific – similar to what happened in 2018 when the Fed abruptly pivoted away from QT as the Real Fed Funds Rate barely eclipsed 0%. So, from recent history, this suggests the sufficiently restrictive level financially is in the 0.00-0.50% range, which again suggests more room for another (25 bps) hike, maybe two.
Of course, the Fed will be looking at other measures as well, such as the money supply, bank lending measures, access to credit, labor market wage inflation, etc.
Source: Ned Davis Research, Federal Reserve
Bitcoin hits $30,000
Cryptocurrency prices have been steadily climbing in 2023 amidst renewed interest in risk assets, and the grandaddy of them all – Bitcoin (BTC) – just made headlines as its price rallies to fresh highs of the year.
The world’s largest digital asset peaked in November 2021 around $65k and dropped more than 75% over the next year. It ultimately found support around $15k at the end of 2022, just after FTX imploded and Tom Brady abandoned his laser eyes.
Now, Bitcoin has eclipsed $30,000 for the first time since June 2022. Here is a look at the new 10-month highs in a daily candlestick chart going back to the first quarter of 2022:
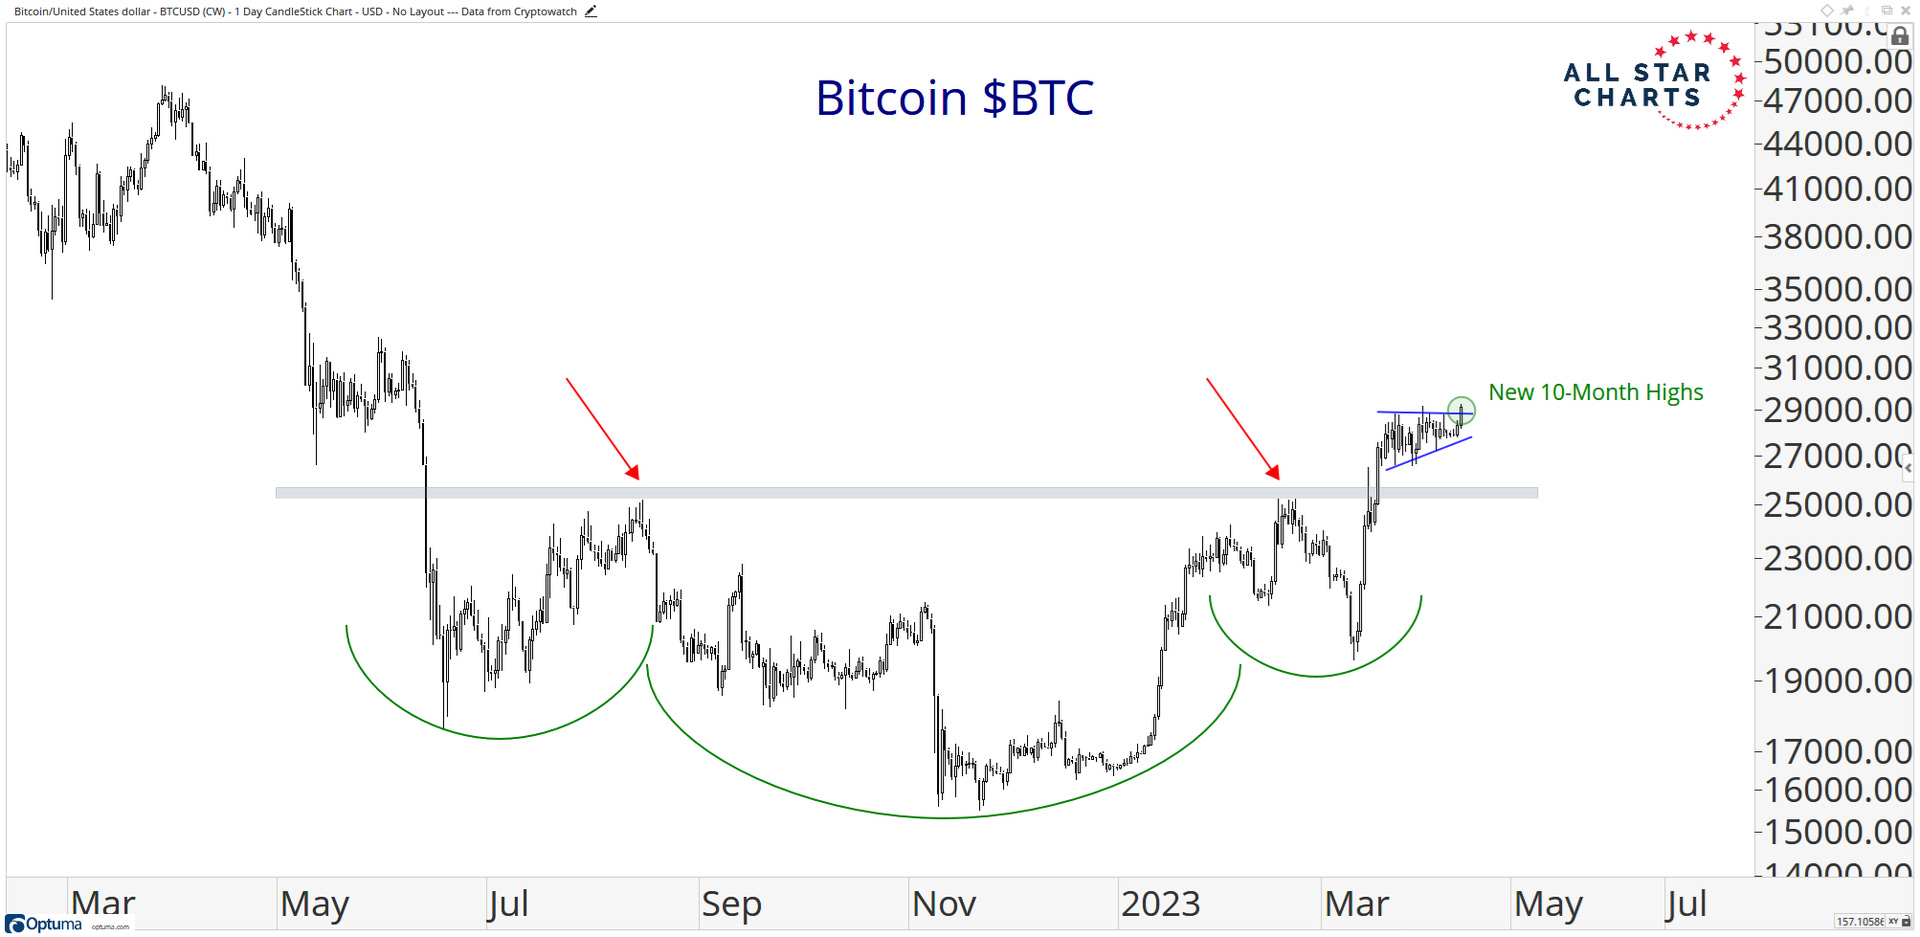
This is a textbook example of a bearish-to-bullish reversal pattern with a breakout zone at last summer's highs just north of $25,000. Technical analysts refer to this formation as an inverse head and shoulders pattern.
Bitcoin resolved higher from this massive base last month, suggesting a new mark-up phase could be underway for the world’s largest cryptocurrency.
Source: All Star Charts
Earnings season kicks off
Consensus expectations are for S&P 500 earnings-per-share (EPS) to fall by -7% YoY, the largest decline since 3Q20 and a significant deterioration from the -1% YoY growth posted in 4Q22. However, if analyst projections are realized, this quarter will represent the trough in S&P 500 earnings growth.

Materials (-32%) and Health Care (-20%) are expected to report the largest earnings declines. Communication Services (-18%) and Info Tech (-16%) stocks are also expected to announce dramatic EPS declines despite recent surging share prices of some of these sectors' largest constituents. At the other extreme, both Energy and Industrials sectors are expected to post YoY EPS growth of +11%, followed by Consumer Discretionary at +9%.

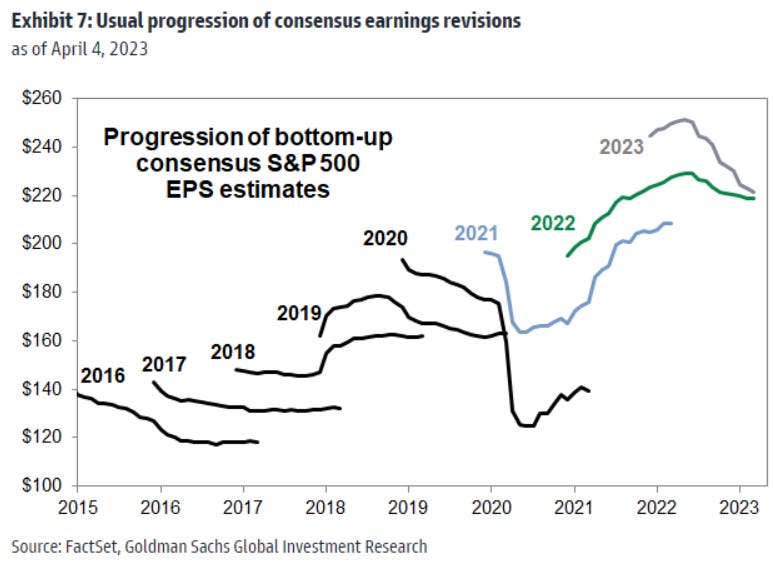
Calendar Year 2023 earnings expectations have certainly come down. Typically, consensus forecasts are too optimistic and are cut by ~7% on average across the entire forecast period. Consensus bottom-up 2023 EPS have already been cut by 12% since June 2022 and by 4% YTD. So perhaps expectations have sank enough for the market to clear the low bar.
87% of the S&P 500 will report earnings in the next 4 week, so the market will have a much better understanding of current market conditions in short order. Expect the market to discuss these four important topics: margin outlook, references to artificial intelligence, signs of slowing CapEX commitments and cash outlays, and evidence of a China reopening boost.

Source: Goldman Sachs Global Investment Research
Law of diminishing marginal return
So often we become acutely focused on the finish line that we fail to enjoy the journey along the way.
The law of diminishing marginal return suggests decreasing levels of utility/satisfaction the more something is consumed. Staying ahead, or aspiring to be “successful,” or worse yet, getting that big paycheck – the reality is there is no finish line because there’s always more to be gained.
Life is not a problem to be solved but a reality to be experienced along the way. Enjoy your family, friends, health, and shared experiences at each moment on life’s journey.

Source: The Reformed Broker
That’s all for today.
Blake
Welcome to The Sandbox Daily, a daily curation of relevant research at the intersection of markets, economics, and lifestyle. We are committed to delivering high-quality and timely content to help investors make sense of capital markets.
Blake Millard is the Director of Investments at Sandbox Financial Partners, a Registered Investment Advisor. All opinions expressed here are solely his opinion and do not express or reflect the opinion of Sandbox Financial Partners. This Substack channel is for informational purposes only and should not be construed as investment advice. Clients of Sandbox Financial Partners may maintain positions in the markets, indexes, corporations, and/or securities discussed within The Sandbox Daily.