Market leadership, plus leading economic indicators, U.S. dollar breakdown, and the week in review
The Sandbox Daily (7.21.2023)
Welcome, Sandbox friends.
Today’s Daily discusses:
is leadership broadening or rotating?
price is only the tip of the iceberg
leading economic indicators still show weakness ahead
U.S. dollar breakdown
a brief recap to snapshot the week in markets
It’s summer Friday, folks. Hope everyone has a great weekend !!
We had ourselves a killer sunset in Annapolis tonight. WOW:
Let’s dig in.
Markets in review
EQUITIES: S&P 500 +0.03% | Dow +0.01% | Nasdaq 100 -0.26% | Russell 2000 -0.35%
FIXED INCOME: Barclays Agg Bond +0.07% | High Yield +0.25% | 2yr UST 4.846% | 10yr UST 3.837%
COMMODITIES: Brent Crude +1.49% to $80.89/barrel. Gold -0.26% to $2,005.3/oz.
BITCOIN: +0.39% to $29,924
US DOLLAR INDEX: +0.20% to 101.085
CBOE EQUITY PUT/CALL RATIO: 0.61
VIX: -2.79 % to 13.60
Quote of the day
“To invest successfully over a lifetime does not require a stratospheric IQ, unusual business insights, or inside information. What's needed is a sound intellectual framework for making decisions and the ability to keep emotions from corroding that framework.”
- Warren Buffett, Berkshire Hathaway
Is leadership broadening or rotating?
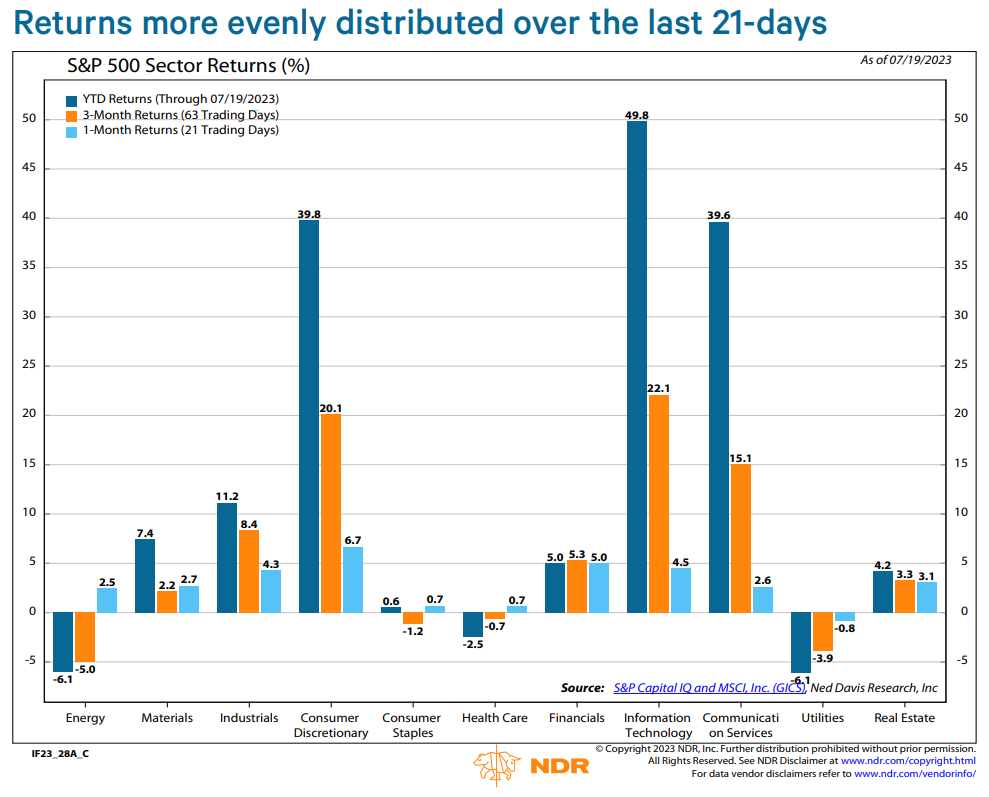
One of the common criticisms of the 1st-half rally was the historically narrow leadership that developed in the aftermath of the regional bank failures. Most of the market’s gains were attributable to a handful of stocks across three Growth sectors: Technology, Consumer Discretionary, and Communication Services.
Over the last few months, there has been increasing evidence of broadening participation. The percentage of S&P 500 stocks trading above their 200-day moving average rose from 37.1% on May 25 to a high of 69.7% on July 13th.
From a sector perspective, the chart below shows that while returns for Technology, Communication Services, and Consumer Discretionary have been head and shoulders above all other sectors year-to-date (dark blue bars) and over the last 63-days (orange bars), there has been much more parity among sector performances over the last 21-days (light blue bars).
This is great news and what investors have been looking for: laggards catching up to the leaders.
While breadth is unquestionably better now than just a few weeks ago, evidence of a decisive sector leadership rotation is lacking.
Source: Ned Davis Research
One simple graphic
Investing is hard.
Price is only the tip of the iceberg, which itself cannot be understated. One can learn a lot from just looking at price, including but not limited to understanding a stock’s general trend, its momentum, relative strength, and consumer sentiment around the market/sector/company. These tools are critical for shorter-term time horizons.
However, there are many other important fundamental considerations lying beneath the surface that drive long-term value and stockholder returns. Understanding these quantitative and qualitative metrics are the foundation for building long-term positions with a higher degree of confidence.
Source: Brian Feroldi
Leading indicators still show weakness ahead
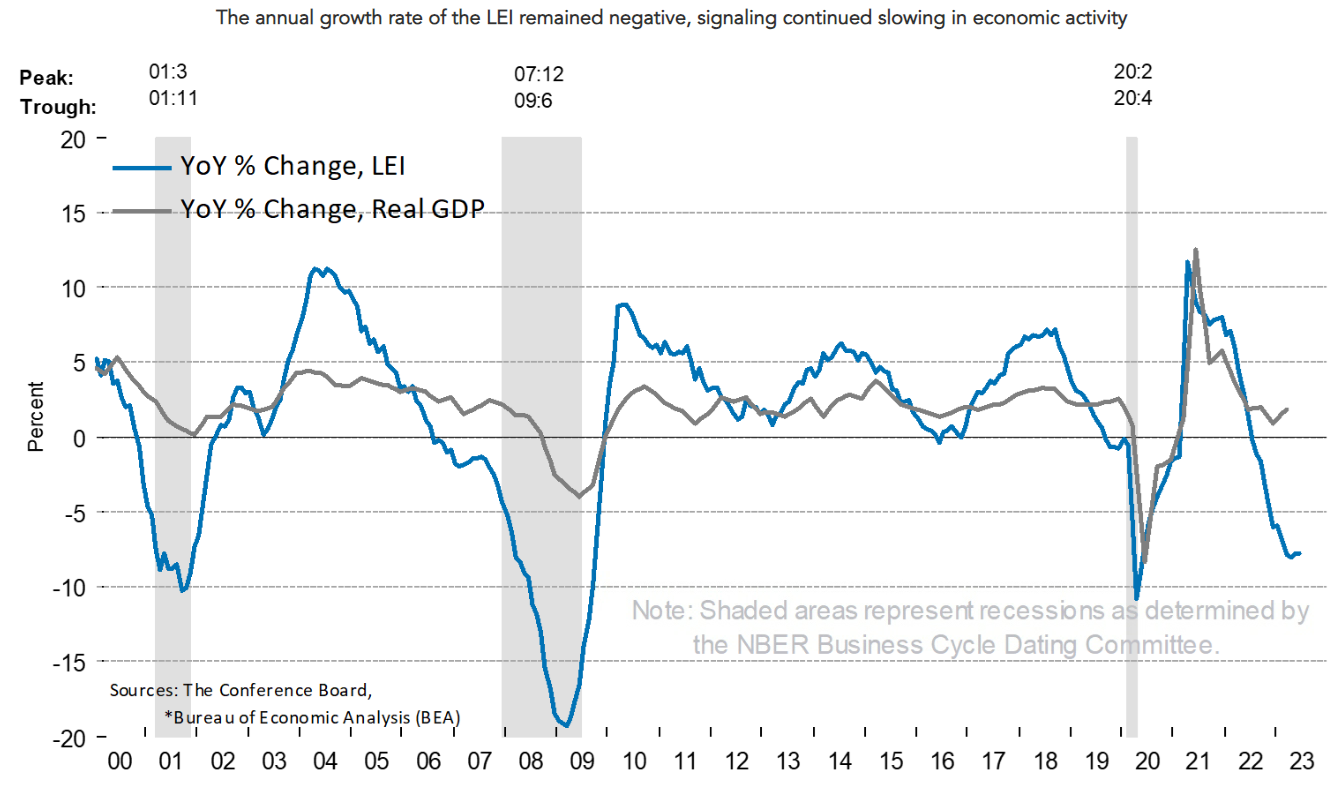
While a number of recent economic indicators, mostly labor market and services activity related, show a diminishing risk of recession in the near-term, the Conference Board’s Leading Economic Index (LEI) suggests the sky is not all clear.
The U.S. Leading Economic Indicators (LEI) index, compiled by the Conference Board, sank -0.7% in June. The decline was the 15th contraction in a row.
Declines of this magnitude have always been associated with recession.
The Conference Board publishes leading, coincident, and lagging indexes designed to signal peaks and troughs in the business cycle for major global economies. Many economists and investors track this measure closely.
As shown below, such a streak of consecutive monthly declines has led to 7 of the last 8 recessions; the only instances we’ve had more consecutive declines were the recessions that started in 1973 and 2007. The pandemic-related recession is the outlier, but given the unexpected and somewhat random nature of the pandemic, it is not surprising that this indicator or any other leading indicator could not forecast it.
The rate of decline in the LEI and the weak indicator breadth are historically consistent with falling economic activity. The Conference Board expects further economic softness in the coming months and a recession starting in the 2nd half of 2023 or into Q1 of 2024.
Clearly the forward-looking indicators suggest enduring, widespread weakness across the economy. While no forecasting system is perfect, this one has a pretty good track record.
Source: The Conference Board, Ned Davis Research, Liz Ann Sonders
U.S. dollar breakdown
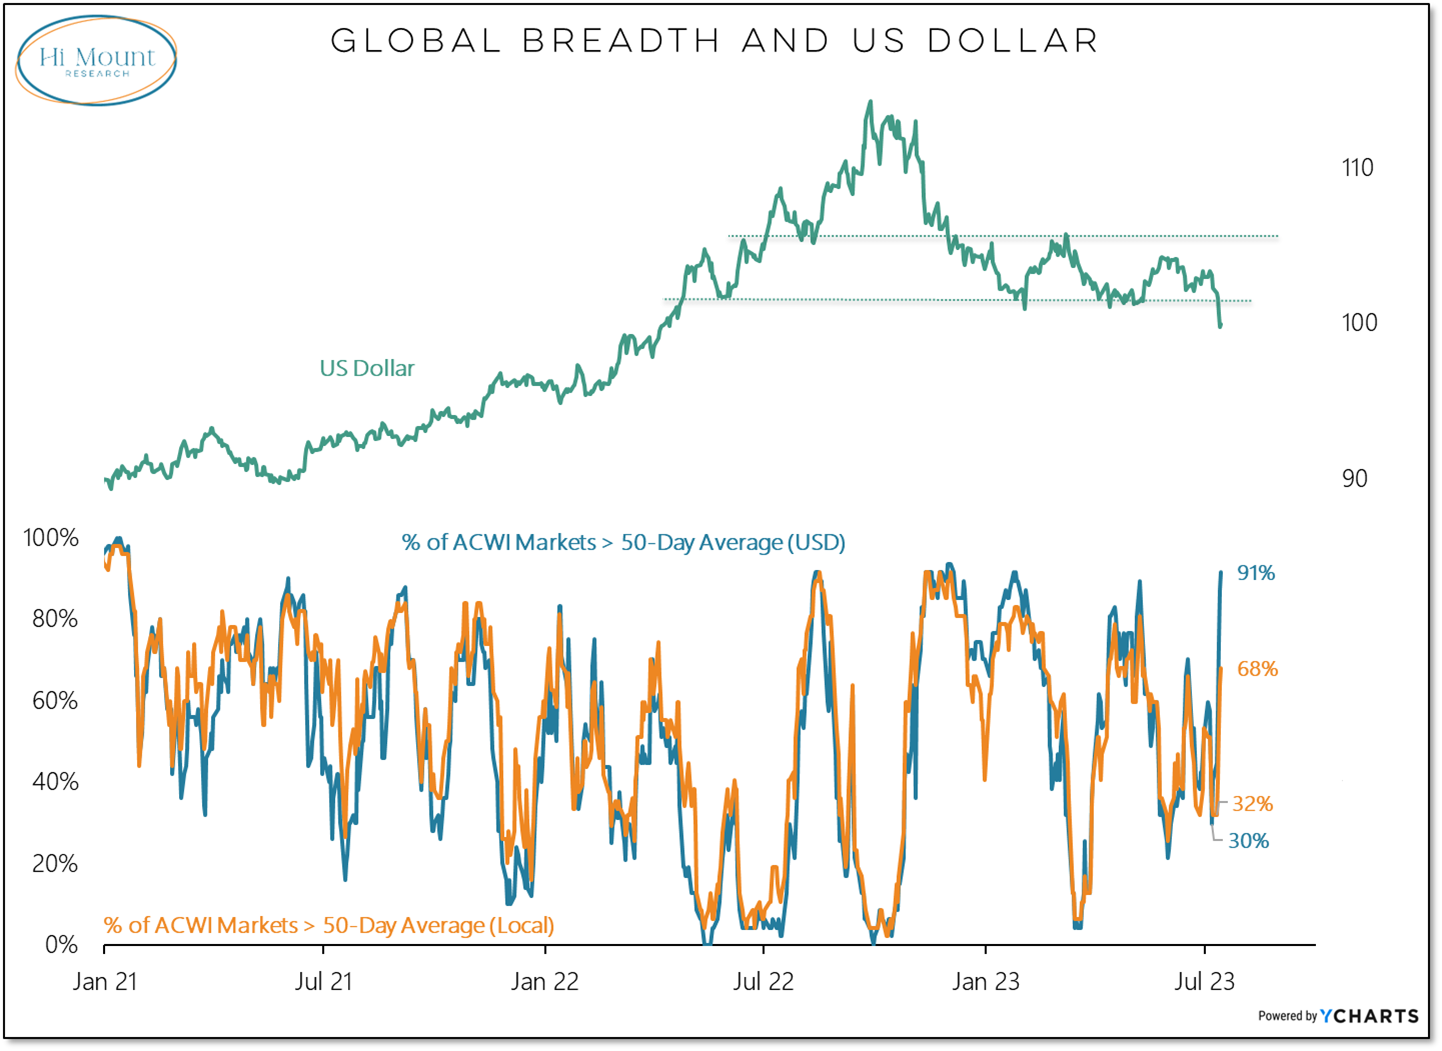
Stocks, both in the U.S. and around the world, are receiving a nice bump from the decline in the U.S. dollar.
Here is the U.S. Dollar breaking down to 52-week lows:
While the percentage of global markets above their 50-day averages has more than doubled when calculated in local currencies (up to 68% from 32%), it has tripled when calculated on a USD-basis (from 30% to 91%).
A weaker dollar remains a tailwind for risk assets and a major catalyst for stocks in 2023.
Source: Hi Mount Research
The week in review
Talk of the tape: Market risk remains to the upside. Soft-landing expectations are the key driver of the bullish narrative. Disinflation traction, most recently delivered via the softer June CPI and PPI prints, cited as another tailwind. Consumer resilience, although showing some signs of fatigue, continues to be a bright spot. The Treasury General Account (TGA) rebuild has not been the big drag on reserves and liquidity that many feared. Improvement in market breadth following the longstanding scrutiny around 2023’s narrow mega-cap tech+ leadership flagged as another driver for markets.
Bears remain focused on the higher-for-longer Fed, liquidity headwinds, earnings/margin risk, and lagged effects of policy tightening. Some concerns linger about overbought conditions and stretched valuations. Fedspeak still tilts hawkish.
Markets are shifting their attention to 2nd quarter earnings over the coming weeks.
Stocks: The major U.S. market indexes ended the week mostly higher despite a disparate view of earnings reports in the early days of second quarter earnings season. High-profile reports from Tesla (TSLA) and Netflix (NFLX) gave bearish investors some solace. Meanwhile, the Dow Jones Industrial Average has gained ground for ten straight sessions.
Investors Intelligence reported bulls increased to 54.2% for the week-ending July 18, up from 51.4% the prior week. The report noted that bulls are now just shy of the 54.9% reading at the end of June, which represents the highest percentage since November 2021’s 57.2% level, causing some to believe the markets may be overbought.
Bonds: The Bloomberg Aggregate Bond Index finished the week marginally lower as traders anticipate next Wednesday’s FOMC meeting.
Commodities: Energy prices ended the week higher as the major metals (gold, silver, and copper) finished mixed. Supply cuts from OPEC and production disruptions are causing oil prices to increase. Rising tensions between Russia and Ukraine could further lower supplies, causing commodity and agriculture prices to increase. China’s stimulus measures might also put upward pressure on commodities.
Source: Dwyer Strategy, LPL Research
That’s all for today.
Blake
Welcome to The Sandbox Daily, a daily curation of relevant research at the intersection of markets, economics, and lifestyle. We are committed to delivering high-quality and timely content to help investors make sense of capital markets.
Blake Millard is the Director of Investments at Sandbox Financial Partners, a Registered Investment Advisor. All opinions expressed here are solely his opinion and do not express or reflect the opinion of Sandbox Financial Partners. This Substack channel is for informational purposes only and should not be construed as investment advice. Clients of Sandbox Financial Partners may maintain positions in the markets, indexes, corporations, and/or securities discussed within The Sandbox Daily.


Read this market wrap up because of Sam Ro tweet today. I have to say, it is terrific. I especially loved the tip of the iceberg chart. In my decades of portfolio management, equity analyst and co-strategist for my money management firm, I have never seen a better teaching tool/explainer. Wish I had had this back then. Definitely a new subscriber. Thank you! Retired CFA