

Market leadership, plus risk tolerance and a key cross-market divergence
The Sandbox Daily (8.28.2023)

Welcome, Sandbox friends.
Today’s Daily discusses:
market leadership
risk tolerance
key cross-market relationship diverges
Let’s dig in.
Markets in review
EQUITIES: Russell 2000 +0.83% | Nasdaq 100 +0.74% | S&P 500 +0.63% | Dow +0.62%
FIXED INCOME: Barclays Agg Bond +0.22% | High Yield +0.38% | 2yr UST 5.052% | 10yr UST 4.206%
COMMODITIES: Brent Crude -0.15% to $84.35/barrel. Gold +0.42% to $1,948.1/oz.
BITCOIN: +0.37% to $26,145
US DOLLAR INDEX: -0.06% to 104.013
CBOE EQUITY PUT/CALL RATIO: 0.97
VIX: -3.83% to 15.08
Quote of the day
“We're not in a reversion TO the mean business. We're in a reversion BEYOND the mean business.”
- John Roque
Market leadership
Your 2023 leadership groups all remain below key levels. Breakouts or breakdowns across these various segments will likely indicate how the rest of 2023 plays out.
When you hear the words “overhead supply,” this is what that means:

Technology, Homebuilders, Industrials, and Semiconductors are all stuck below those former cycle highs. It will be hard for the major indexes to complete their next leg higher without these groups participating.
So, in their absence and during this recent period of weakness in equities, where has strength emerged?
It must be Energy, where ALL of the underlying 23 constituents in the Energy Select Sector ETF (XLE) are trading above a rising 50-day moving average.

What makes Energy's rebound so remarkable is that it was among the weakest sectors for the 1st half of the year. At the end of June, Energy's -5.4% year-to-date decline was only slightly better than the -5.7% drop in Utilities.
Since June, different story – Energy is leading all sector groups which has even helped repair some long-term trends.
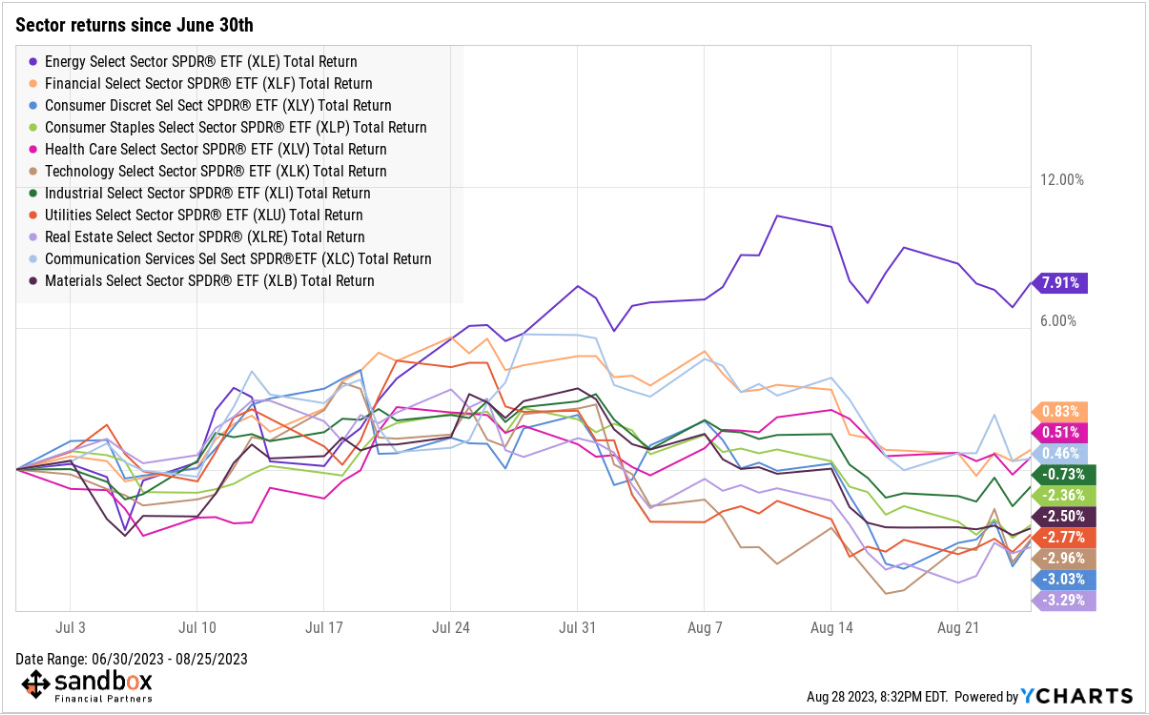
Energy has benefited from rising commodity prices and a slew of economic data that suggests a U.S. recession is not imminent. On the supply side, crude has been bolstered by voluntary production cuts from OPEC+, as well as an additional unilateral cut of 1.0 million barrels a day from Saudi Arabia that will be in effect at least through the end of September.
Source: All Star Charts, Ned Davis Research
Risk tolerance
In his book The Four Pillars of Investing, William Bernstein writes: “If your portfolio risk exceeds your tolerance for loss, there is a high likelihood that you will abandon your plan when the going gets rough.”
For most people, there is a range of asset allocations that will meet their needs and goals from a strictly mathematical point of view. There are no shortage of metrics for investors to consider: rolling returns, standard deviation (i.e. dispersion), magnitude and length of drawdowns, percentage of monthly returns positive to negative, portfolio yield, and on and on and on. This is “life in a vacuum.”
But to choose among those viable portfolio options, you then need to set aside the calculator and consult your tolerance for risk and volatility IRL, or what the kids call “in real life.” Some of these exercises can include looking at past performance and trade activity to understand how you reacted to difficult markets; others include questionnaires, surveys, personality tests, or perhaps assessing other activities and interests in your life to assess your responses to risk-taking endeavors.

Ultimately, you must strike the right balance between life-in-a-vacuum and in-real-life to ensure with the highest degree of probability that you can stick with your portfolio through the market's regular ups AND downs.
Striking that balance should get you closer to the appropriate risk tolerance you seek.
Source: Napkin Finance
Key cross-market relationship diverges
Stock valuations provide a gauge of the actual price of a stock. Unlike most goods and services, the dollar price of a stock doesn't tell us how rich or cheap it is. What matters are valuations – the multiple investors are willing to pay for earnings, sales, cashflows, or a host of other metrics.
Meanwhile, real rates are interest rates minus the inflation rate or expected inflation rate. Like stock valuations, they help us assess whether bond yields are too rich or cheap versus the inflation climate.
The chart below shows their historical relationship, which tracked quite well until the recent decoupling over the last year or so:

Low or negative real rates are economically stimulative. Consequently, periods of low real rates tend to accompany higher stock valuations.
Conversely, as we have today, high real rates are restrictive of economic activity and tend to weigh on corporate profits and stock prices.
As shown in the chart above, real rates have risen sharply to fifteen-year highs (right axis, inverted), while stock valuations have quickly gotten expensive (left axis). The gap between them is not sustainable. Will this divergence resolve through lower yields or more inflation? Or, perhaps higher earnings or even falling stock prices?
Source: Liz Young
That’s all for today.
Blake
Welcome to The Sandbox Daily, a daily curation of relevant research at the intersection of markets, economics, and lifestyle. We are committed to delivering high-quality and timely content to help investors make sense of capital markets.
Blake Millard is the Director of Investments at Sandbox Financial Partners, a Registered Investment Advisor. All opinions expressed here are solely his opinion and do not express or reflect the opinion of Sandbox Financial Partners. This Substack channel is for informational purposes only and should not be construed as investment advice. The information and opinions provided within should not be taken as specific advice on the merits of any investment decision by the reader. Investors should conduct their own due diligence regarding the prospects of any security discussed herein based on such investors’ own review of publicly available information. Clients of Sandbox Financial Partners may maintain positions in the markets, indexes, corporations, and/or securities discussed within The Sandbox Daily. Any projections, market outlooks, or estimates stated here are forward looking statements and are inherently unreliable; they are based upon certain assumptions and should not be construed to be indicative of the actual events that will occur.