

Midterm elections, plus U.S. gov't interest payments, energy strength, yield curve inversions, and investing mistakes
The Sandbox Daily (11.8.2022)

Welcome, Sandbox friends.
Today’s Daily discusses the 2022 midterm elections, U.S. government interest expense ready to explode, energy participation broadens out, yield curve inversions spell a cautionary tale for economic recession, and how to learn from your investing mistakes.
Let’s dig in.
Markets in review
EQUITIES: Dow +1.02% | Nasdaq 100 +0.75% | S&P 500 +0.56% | Russell 2000 -0.05%
FIXED INCOME: Barclays Agg Bond +0.43% | High Yield -0.10% | 2yr UST 4.655% | 10yr UST 4.125%
COMMODITIES: Brent Crude -2.93% to $95.11/barrel. Gold +2.10% to $1,715.8/oz.
BITCOIN: -10.91% to $18,374
US DOLLAR INDEX: -0.45% to 109.629
CBOE EQUITY PUT/CALL RATIO: 0.67
VIX: +4.89% to 25.54
2022 midterm elections
Today is midterm Election Day. Millions of voters across the United States will cast their ballots in one of the most highly anticipated midterm elections in recent years. Polls suggest the final weeks of campaigning were defined by a shift in momentum toward Republicans, driven by persistent inflation and economic concerns.
Historically speaking, Wall Street prefers gridlock between party lines, and performs well in the period following midterms. Many are banking on the seasonality to spark a rally this year, but with the Fed taking away the punch bowl, is this time different?
The S&P has historically outperformed the market in the 12-month period after a midterm election, with an average return of 16.3%. Also nice to see all 6-month and 12-month forward returns were positive since 1962. Let’s hope the trend is our friend!

Most observers appear confident that Republicans will win a House majority. That expectation, along with the difficulty congressional Democrats had in passing a scaled-back fiscal package this year, has likely led to expectations that Congress will do little next year regardless of the election outcome. However, Goldman Sachs expects at least some of the policy repercussions next year under a divided government to be large enough to have macroeconomic effects. In particular, the need to raise the debt limit in 2023 could lead to meaningful fiscal tightening in 2024, and divided government could make a fiscal response to a potential recession less likely to pass and smaller if it does.
The exhibit below summarizes Goldman’s views of fiscal policy under different election and economic outcomes. As a friendly reminder, Republicans need to pick up five seats in the House or just one in the Senate to shift the balance of power.

However, Goldman Sachs equity market analyst Ben Snider of Goldman Sachs had this to say in a recent accompanying note: "The election appears to rank relatively low on the list of macro factors concerning equity investors. Inflation, monetary policy, recession risk, and geopolitics have been far more important drivers of equity market moves than the potential for modest changes in US fiscal policy.”
Source: Grit Capital, Goldman Sachs Global Investment Research
U.S. government interest expense ready to explode
Total outstanding government debt currently stands at just over $31 trillion and that number will likely increase, regardless of which party is in power.
According to the Congressional Budget Office (CBO), total interest payments on the government’s debt came in at $475 billion dollars during fiscal year 2022 - equivalent to roughly $3,055 per household - and is up from $352 billion in 2021. The cost to finance America’s growing mountain of debt shows the federal government spent more on interest payments than it did on veterans’ programs, food and nutrition services, Social Security Disability Insurance, education – among many other programs. And those interest expenses will continue to rise…

The Fed has stated that interest rates are likely going to be at these elevated levels for a few years in an effort to slow aggregate demand. Higher for longer will certainly impact the costs associated with servicing government debt. And unlike many corporations that termed out debt to take advantage of low interest rates, the Treasury Department maintained its historical issuance schedule and now over 40% of existing Treasury debt will need to be refinanced before 2025!

Currently, the weighted average coupon for existing debt is slightly under 1.8%. However, with most tenors across the U.S. Treasury yield curve above 4%, coupon levels will most assuredly go higher and will likely push debt service costs closer to $1 trillion annually in the coming years as the U.S. government rolls near-term debt over at higher rates.
Source: Committee for a Responsible Federal Budget, U.S. Department of the Treasury, LPL Research
Participation expands for energy
While energy stocks have shown relative strength all year long, their leadership has drastically accelerated off their September lows.
The large-cap Energy Sector SPDR (XLE) may be breaking out, as it closed at its highest level since 2014 today.

Whether looking at explorers and producers, oil services, or, more recently, midstream companies, participation continues to broaden among energy stocks, confirming the bullish price action and sector leadership from the top down.
The Global X MLP ETF (MLPA) and Oil & Gas Equipment and Services ETF (XES) are on the verge of reclaiming key levels of former support turned resistance. While MLPA just printed multi-year highs last week, many are watching for upside follow-through from both ETFs over the coming days.
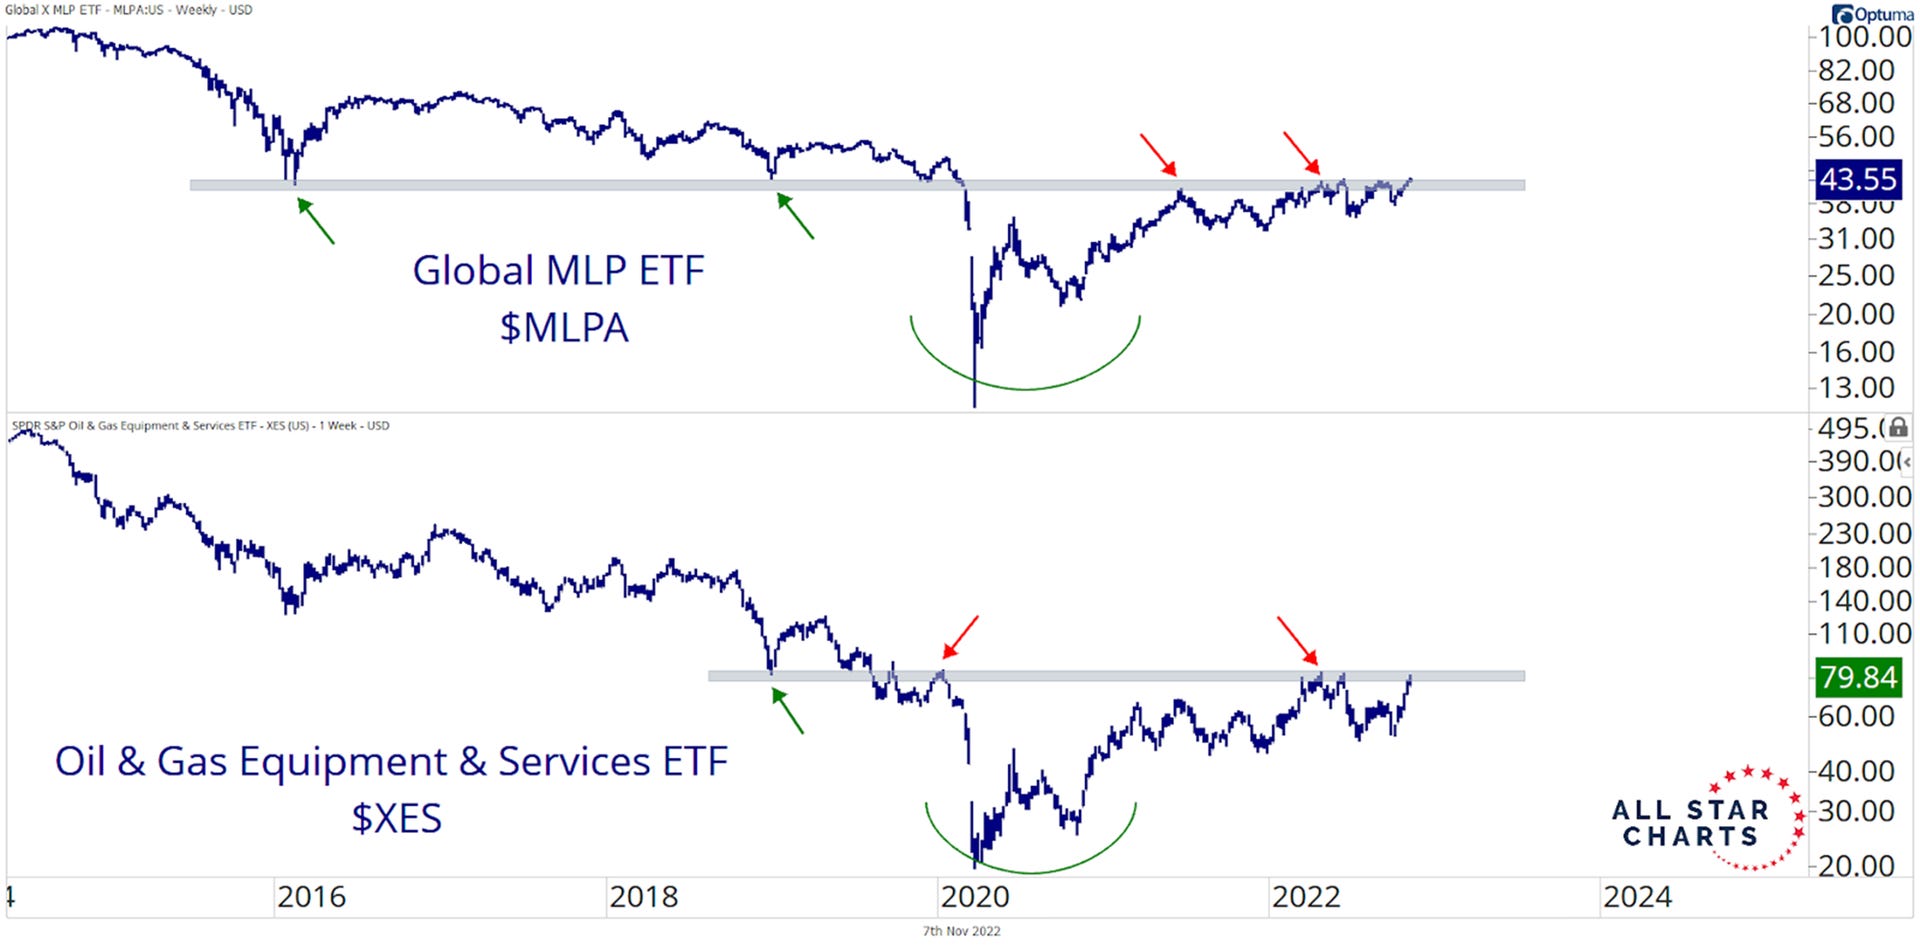
Source: All Star Charts
Yield curve inversions a cautionary tale for economic recession
Yield curve inversions spook investors because of what it portends for the economy in the coming months and years.
Everyone has a different spread they prefer when looking at the shape and slope of the yield curve. The Fed has often stated they track the 3 month–10 year spread, while many investors follow the 2 year–10 year spread. When using a range of yield curve indicators from 3 months to 30 years, we come up with many combinations of yield curve spreads that give us information. Remember, we borrow using the short-dated rate and lend at the long-dated rate so the yield curve is traditionally upward sloping to compensate for duration (ie time) risk.
Historically speaking, when you have more than 55% of yield curve spread combinations turn negative, a recession has followed every time. Currently the percentage of U.S. Treasury yield curves that are inverted is at 69%, which is actually down slightly from last week’s reading of 75%.

The data strongly suggests that a recession is looming on the horizon.
Source: Tony Dwyer
Grow through your mistakes
Every investor makes mistakes. Determine what went wrong and use that painful experience for personal growth and development as an investor. Here is one example/flow chart showing how you can learn from them.

Source: Compounding Quality
That’s all for today.
Blake
Welcome to The Sandbox Daily, a daily curation of relevant research at the intersection of markets, economics, and lifestyle. We are committed to delivering high-quality and timely content to help investors make sense of capital markets.
Blake Millard is the Director of Investments at Sandbox Financial Partners, a Registered Investment Advisor. All opinions expressed here are solely his opinion and do not express or reflect the opinion of Sandbox Financial Partners. This Substack channel is for informational purposes only and should not be construed as investment advice. Clients of Sandbox Financial Partners may maintain positions in the markets, indexes, corporations, and/or securities discussed within The Sandbox Daily.