Narrow market leadership, plus Q3 earnings season, small businesses, and shelter inflation
The Sandbox Daily (10.24.2023)
Welcome, Sandbox friends.
Today’s Daily discusses:
narrow market leadership
Q3 earnings season ramps up
impact of higher rates on small businesses
the lag/distortion in shelter inflation
Let’s dig in.
Markets in review
EQUITIES: Nasdaq 100 +0.97% | Russell 2000 +0.82% | S&P 500 +0.73% | Dow +0.62%
FIXED INCOME: Barclays Agg Bond +0.36% | High Yield +0.51% | 2yr UST 5.108% | 10yr UST 4.821%
COMMODITIES: Brent Crude -1.75% to $88.26/barrel. Gold -0.15% to $1,973.3/oz.
BITCOIN: +6.86% to $33,746
US DOLLAR INDEX: +0.69% to 106.264
CBOE EQUITY PUT/CALL RATIO: 0.52
VIX: -6.87% to 18.97
Quote of the day
“It is always useful to remember that the most important events in any year generally aren’t recognized until they happen. Risk managers will always have an impossible job because risk is, by definition, what isn’t expected.”
- Richard Bernstein, Grease and Greece
Narrow market leadership
The Russell 3000 Index is a capitalization-weighted stock market index that seeks to be a benchmark of the entire U.S stock market. It measures the performance of the 3,000 largest publicly held companies incorporated in America as measured by total market capitalization, and represents approximately 98% of the American public equity market.
By that definition, the Russell 3000 is a broad and fair representation of the U.S. stock market in its totality.
60% of the constituents in the Russell 3000 are down on the year while the median stock is down -7.7%, yet the index is up +8.9% year-to-date.
Source: Worth Charting
Q3 earnings season ramps up
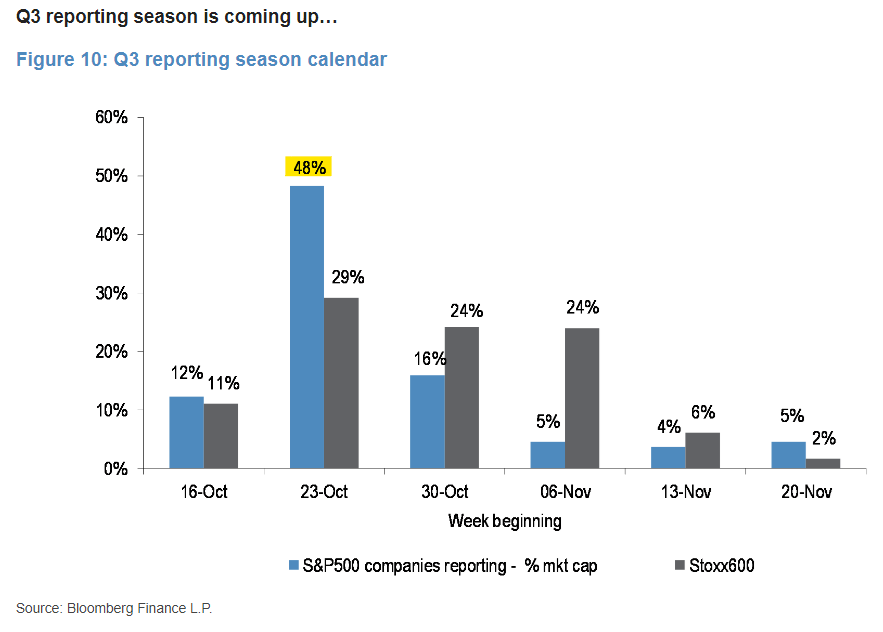
We are entering the busy period of the Q3 reporting season, with nearly half of S&P 500 companies by market capitalization set to report this week.
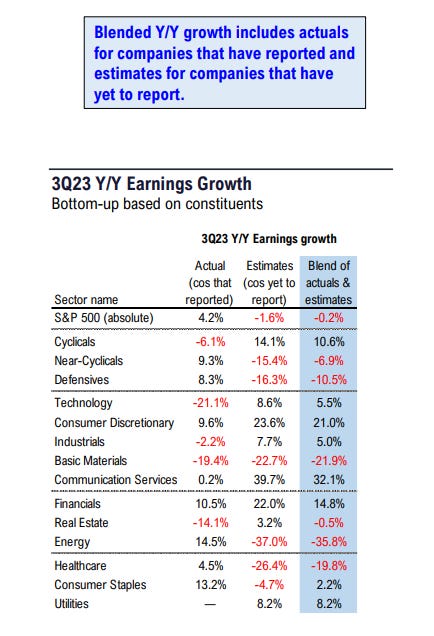
The hurdle rate for corporate America appears rather low, as Q3 EPS estimates have been revised sharply lower, especially in the 1st half of the year – coming down from just over 5% YoY growth to an outright, albeit small, YoY decline.
Of the 92 companies (18%) in the S&P 500 that have reported, 72% have reported earnings above their estimates, which is below both the 5-year average of 77% and 10-year average of 73%.
The blended earnings decline (blended combines actual results for companies that have reported and estimated results for companies that have yet to report) for the 3rd quarter is -0.2% today, which would mark the 4th consecutive quarter in which the index has reported a year-over-year decline in earnings.
Not exactly the earnings valley that the market expected/priced into markets in 2022, but an earnings recession nonetheless.
Early market reactions to earnings seasons have been lackluster.
With ~20% of S&P 500 index constituents having reported, companies that lagged behind analysts’ estimates on the earnings-per-share (EPS) metric have seen their stock underperform the benchmark index by a median of 3.7% on the day of results. That’s the worst performance in the data’s history going back to the second quarter of 2019.
Even companies beating estimates have trailed the S&P 500 by 0.6%, the first such showing since the fourth quarter of 2020.
Source: J.P Morgan Markets, Fundstrat, Bloomberg
Impact of higher rates on small businesses
Small business financing differs from that of large corporations in two important ways.
1st, small businesses spend a larger share of revenues on interest payments – Goldman Sachs estimates around 6% for small and 2% for large businesses in 2021.
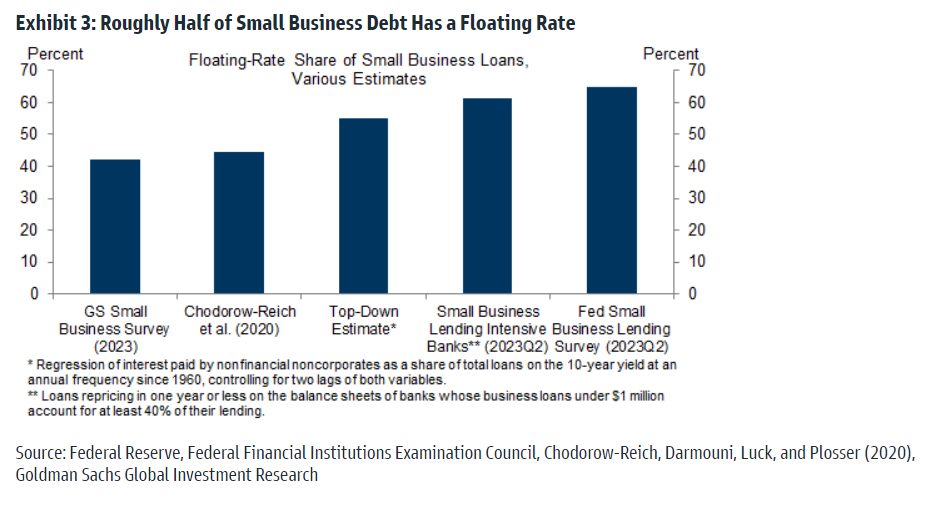
2nd, while the average maturity of small and large business debt appears to be roughly similar, economic research finds that small business debt has a bimodal maturity profile: roughly half consists of credit lines, short-term loans, and other floating-rate debt (vs. 20% for large businesses). Reference the chart below.
The other half of small business debt consists of term loans with 7-year average maturities when issued (vs. 5½-year for large firms).
Source: Goldman Sachs Global Investment Research
The lag in shelter inflation
The Shelter component of the Consumer Price Index (CPI), which is comprised of two sub-categories (1. Owners’ Equivalent Rent and 2. Rent of Primary Residence), is by far the largest input within the inflation basket at 34.8%.
This makes intuitive sense because, broadly speaking, the typical American household may spend roughly 1/3rd of their take home pay on housing.
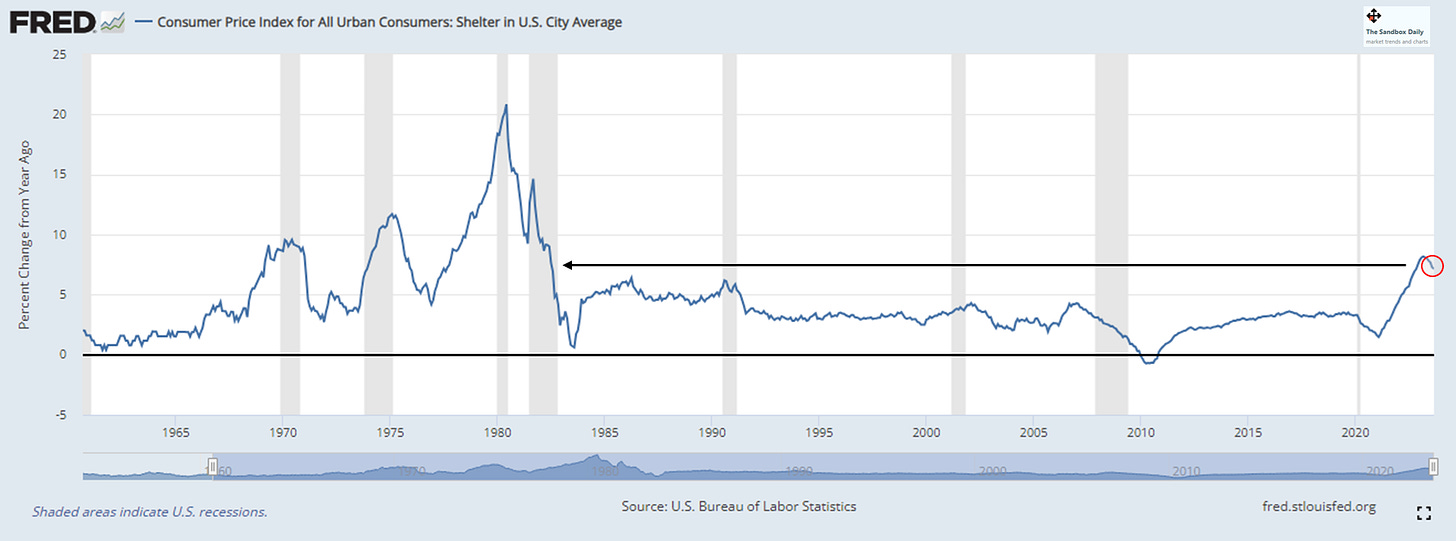
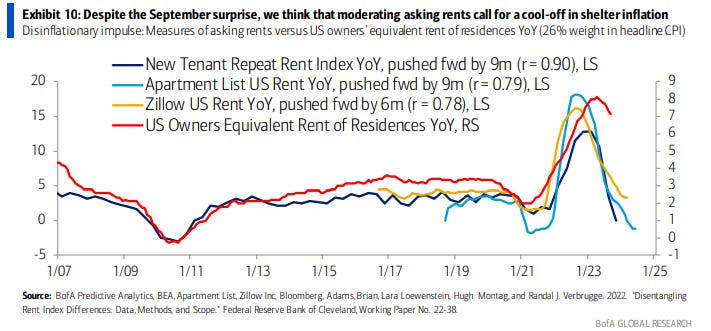
Currently, shelter inflation growth is up +7.2% YoY, which is down a small amount from the cycle peak of +8.2% back in March 2023 but still at the highest level since June 1982.
Unfortunately, the method in which the Bureau of Labor Statistics collects and reports our housing data reflects old, lagging price metrics that are not representative of current market conditions.
In fact, the lagging shelter category continues to be an issue and one of great contention; many Fed watchers would like to see other reputable, more high-frequency data – like the Zillow or Apartment List data series – incorporated into the FOMC’s analysis.
As you can see in the Bank of America chart below, various high-frequency measures of shelter show prices are only up +0.5-2.25% YoY, not +7.2% as reflected in the BLS data.
This implies CPI is much closer to the Fed’s mandated 2% inflation target than the data suggests.
Source: Bureau of Labor Statistics, St. Lous Fed, Apricitas Economics, Mike Zaccardi
That’s all for today.
Blake
Welcome to The Sandbox Daily, a daily curation of relevant research at the intersection of markets, economics, and lifestyle. We are committed to delivering high-quality and timely content to help investors make sense of capital markets.
Blake Millard is the Director of Investments at Sandbox Financial Partners, a Registered Investment Advisor. All opinions expressed here are solely his opinion and do not express or reflect the opinion of Sandbox Financial Partners. This Substack channel is for informational purposes only and should not be construed as investment advice. The information and opinions provided within should not be taken as specific advice on the merits of any investment decision by the reader. Investors should conduct their own due diligence regarding the prospects of any security discussed herein based on such investors’ own review of publicly available information. Clients of Sandbox Financial Partners may maintain positions in the markets, indexes, corporations, and/or securities discussed within The Sandbox Daily. Any projections, market outlooks, or estimates stated here are forward looking statements and are inherently unreliable; they are based upon certain assumptions and should not be construed to be indicative of the actual events that will occur.






Love your curation each day, Blake. Thank you!