NVDA 2nd-most valuable company, plus home payments, strong Presidential summer, patience, economic indicators, and Cyclicals vs. Defensives
The Sandbox Daily (6.5.2024)
Welcome, Sandbox friends.
Nvidia is now the 2nd-most valuable public company (behind Microsoft) as $NVDA passed Apple in market cap today, the S&P 500 and Nasdaq Composite both closed at new record highs, and The Bank of Canada cut their target interest rate. All eyes remain on Friday’s jobs report.
Today’s Daily discusses:
home payments have gotten expensive
strongest 3-month period of Presidential election year cycles
patience is a virtue
3 flavors of economic data
Cyclicals vs. Defensives: what does that even mean?
Let’s dig in.
Markets in review
EQUITIES: Nasdaq 100 +2.04% | Russell 2000 +1.47% | S&P 500 +1.18% | Dow +0.25%
FIXED INCOME: Barclays Agg Bond +0.31% | High Yield +0.32% | 2yr UST 4.726% | 10yr UST 4.283%
COMMODITIES: Brent Crude +1.20% to $78.45/barrel. Gold +1.12% to $2,373.8/oz.
BITCOIN: +1.64% to $71,328
US DOLLAR INDEX: +0.17% to 104.289
CBOE EQUITY PUT/CALL RATIO: 0.61
VIX: -4.03% to 12.63
Quote of the day
“During the downturns, expectations keep getting revised lower and lower in the midst of bad news. Markets fall and investors gets overly pessimistic. The thing is, you don’t even need good news for the tide to turn, just less bad news. It’s not good or bad that matters in the short run but better or worse.
The opposite occurs during uptrends. Expectations keep ratcheting higher and higher as markets rise and investors get overly optimistic. You don’t necessarily need bad news for the good times to end, just less good news.
The key as an investor is to avoid allowing your emotions to match that of the herd.”
- Ben Carlson, Ritholtz Wealth Management in The Minsky Market
Home payments have gotten expensive
The median mortgage payment in the United States was $2,812 as of May month-end – just $58 off its recent record high of $2,870 from April month-end.
That's an increase of +7.3% from 2023, +23% increase from 2022, and +78% increase from 2021, per data from Redfin.
The last one bears repeating: the monthly mortgage payment needed to buy the median priced home for sale in the United States is 78% higher over the last 3 years.
As a result of higher rates, the average monthly mortgage payment is consumed mostly by interest now, as opposed to servicing the underlying principal.
Housing affordability is becoming a real issue.
The Federal Reserve put forward an aggressive string of interest rate hikes as it tried to choke off inflation by slowing the economy and stifling demand. With rates markedly higher in 2024, that means borrowers face higher costs for everything from car loans to credit card debt to… the biggest credit market of them all: mortgages.
Source: Redfin, Michael McDonough
Strongest 3-month period of Presidential election year cycles
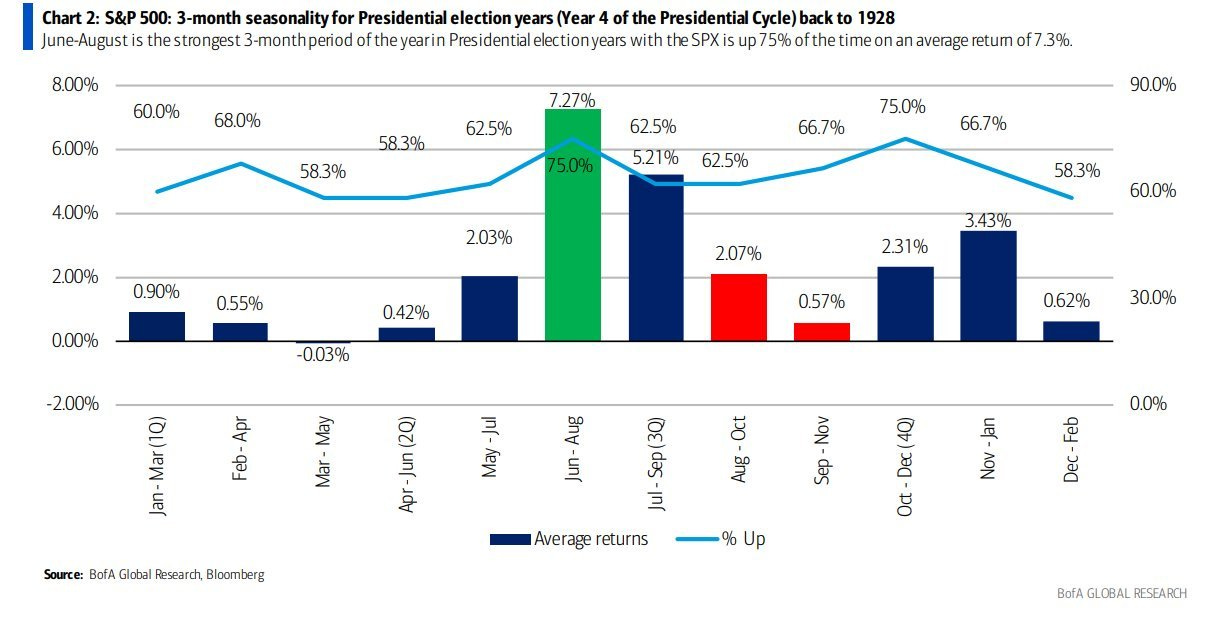
For election seasonals, it can't get any better than the next three months.
The June through August 3-month stretch during the 4th year of election cycles is higher 75% of the time with an average gain of +7.3%.
So much for a summer swoon!
Source: Mike Zaccardi
Patience is a virtue
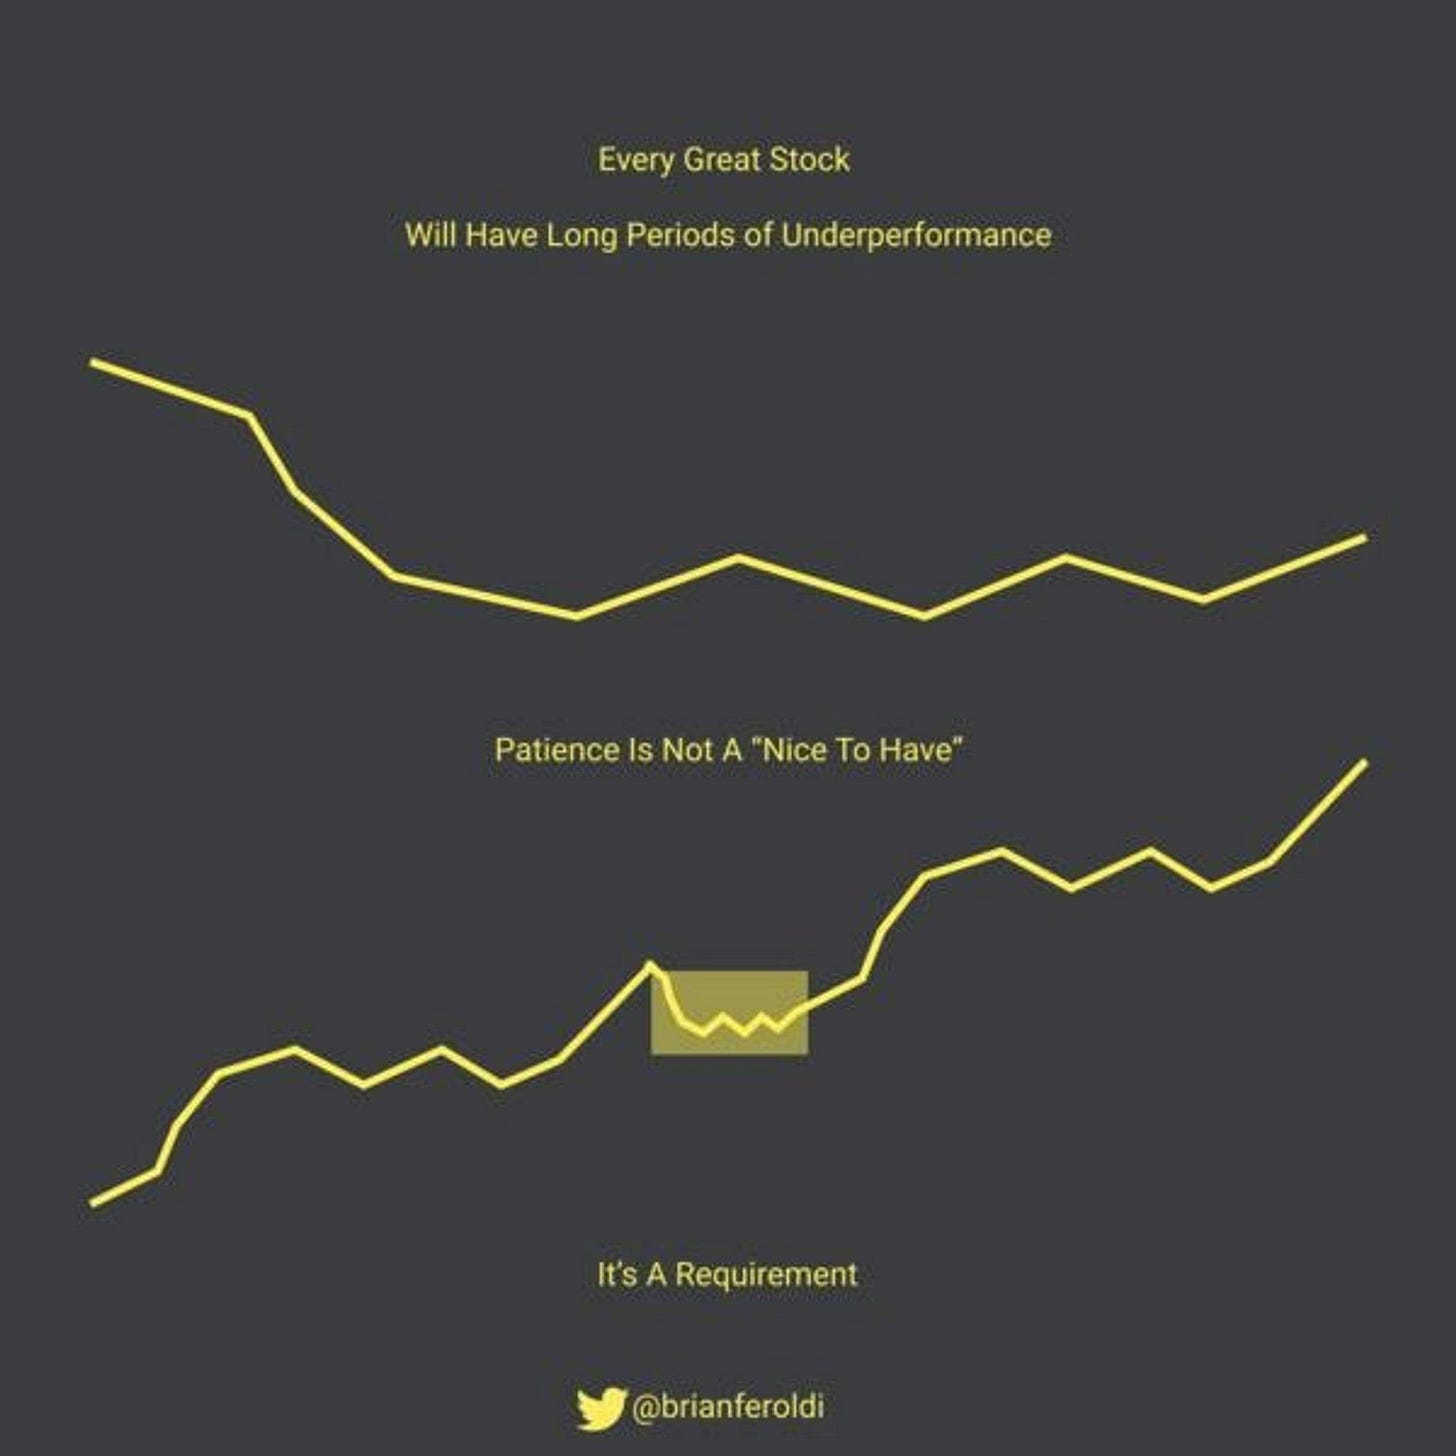
Having patience with a position sometimes means resisting the very natural human bias to act. It’s an important lesson we should remind ourselves from time to time.
To borrow a line from frontman Axl Rose of Guns N’ Roses:
Said woman take it slow, it’ll work itself out fine. All we need is just a little patience.
Source: Brian Feroldi
3 flavors of economic data
If you’ve studies financial statement analysis, you know that there is a lot of data! And yet, understanding which data is most influential for markets is paramount to success.
Macro data can be broken into leading, coincident, and lagging data. Leading economic indicators are most important for investors given that markets trend WITH leading indicators. Coincident and lagging indicators serve more as confirmation than market-moving information.
While financial markets are thought to be forward-looking, the reality is that stocks move with leading indicators.
The chart below of the S&P 500 and the Global Manufacturing PMI (an example of a leading indicator) is one way to illustrate how macro explains market returns.
If you can figure out where leading indicators are headed, you’ve answered one of the most important questions for investing.
Source: Piper Sandler
Cyclicals vs. Defensives: what does that even mean?
A look a Cyclicals outperformance tells us that the market wants more risk.
When sharing/discussing the above chart today, it dawned on me that many people may not even know what Cyclicals are and what is means to be categorized as Defensive.
Cyclicals are generally affected by macroeconomic changes and follow the business cycle and trends of underlying economic growth. They usually have higher volatility and are expected to perform well during economic expansions but typically underperform during recessions as sales and earnings drop. While everyone often has their own preferences on how assets can be categorized, here we take Cyclicals to include Financials, Consumer Discretionary, and Industrials, while Materials and Energy also account for a significant share of the basket.
Defensives tend to perform similarly in terms of sales and profitability no matter what the economy is doing; they can help to protect investments during times of uncertainty but lag in recoveries. Defensives include sectors such as Healthcare, Consumer Staples, and Utilities.
Below is a table showing industry groups at the top which are more tied to economic growth and the business cycle. The industry groups which belong to the more Defensive sectors are at the bottom.
Source: Goldman Sachs Global Investment Research
That’s all for today.
Blake
Welcome to The Sandbox Daily, a daily curation of relevant research at the intersection of markets, economics, and lifestyle. We are committed to delivering high-quality and timely content to help investors make sense of capital markets.
Blake Millard is the Director of Investments at Sandbox Financial Partners, a Registered Investment Advisor. All opinions expressed here are solely his opinion and do not express or reflect the opinion of Sandbox Financial Partners. This Substack channel is for informational purposes only and should not be construed as investment advice. The information and opinions provided within should not be taken as specific advice on the merits of any investment decision by the reader. Investors should conduct their own due diligence regarding the prospects of any security discussed herein based on such investors’ own review of publicly available information. Clients of Sandbox Financial Partners may maintain positions in the markets, indexes, corporations, and/or securities discussed within The Sandbox Daily. Any projections, market outlooks, or estimates stated here are forward looking statements and are inherently unreliable; they are based upon certain assumptions and should not be construed to be indicative of the actual events that will occur.


